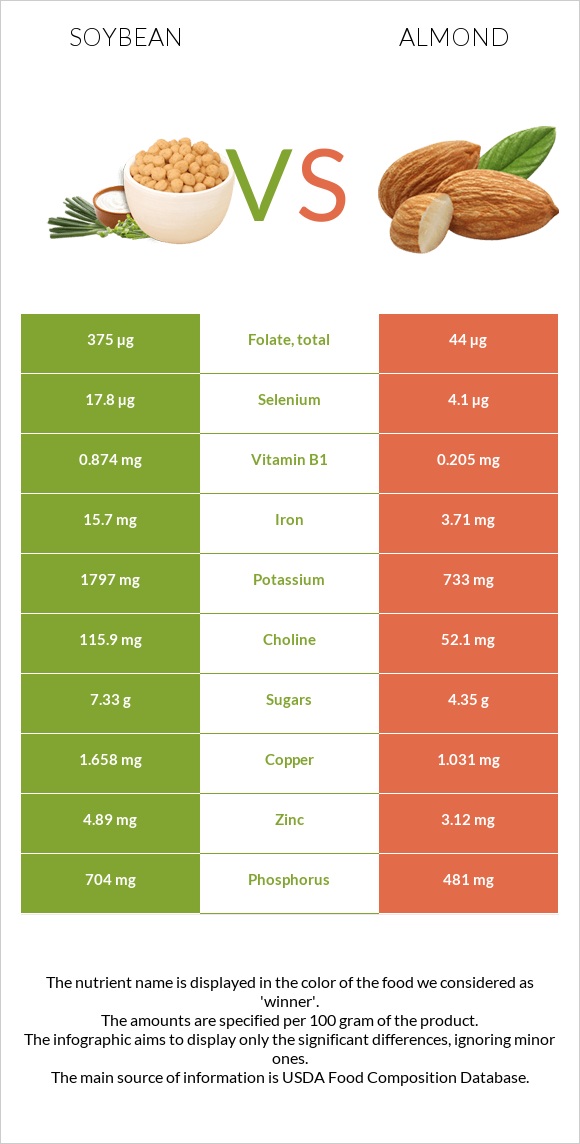
Significant differences between soybeans and almonds Soybeans have more iron; however, almonds are richer in vitamin E, copper, vitamin B2, manganese, magnesium, phosphorus, fiber, vitamin B3, and zinc. Almonds cover your daily vitamin E needs 169% more than soybeans. Soybeans have a higher glycemic index. The glycemic index of soybeans is 14, while the glycemic index of almonds is 0. Specific food types used in this comparison are Soybeans, mature cooked, boiled, without salt and Nuts, almonds .
Infographic
Mineral Comparison
Mineral comparison score is based on the number of minerals by which one or the other food is richer. The "coverage" charts below show how much of the daily needs can be covered by 300 grams of the food.
2
100 g
300 g
1 tbsp - 10.7g 1 cup - 172g
Magnesium
Magnesium
Calcium
Calcium
Potassium
Potassium
Iron
Iron
Copper
Copper
Zinc
Zinc
Phosphorus
Phosphorus
Sodium
Sodium
Manganese
Manganese
Selenium
Selenium
61%
31%
45%
193%
136%
31%
105%
0.13%
107%
40%
7
100 g
300 g
1 almond - 1.2g 1 oz (23 whole kernels) - 28.35g 1 cup, sliced - 92g 1 cup, ground - 95g 1 cup, slivered - 108g 1 cup, whole - 143g
Magnesium
Magnesium
Calcium
Calcium
Potassium
Potassium
Iron
Iron
Copper
Copper
Zinc
Zinc
Phosphorus
Phosphorus
Sodium
Sodium
Manganese
Manganese
Selenium
Selenium
193%
81%
65%
139%
344%
85%
206%
0.13%
284%
22%
Vitamin Comparison
Vitamin comparison score is based on the number of vitamins by which one or the other food is richer. The "coverage" charts below show how much of the daily needs can be covered by 300 grams of the food.
4
100 g
300 g
1 tbsp - 10.7g 1 cup - 172g
Vitamin C
Vit. C
Vitamin D
Vit. D
Vitamin A
Vit. A
Vitamin E
Vit. E
Vitamin B1
Vit. B1
Vitamin B2
Vit. B2
Vitamin B3
Vit. B3
Vitamin B5
Vit. B5
Vitamin B6
Vit. B6
Vitamin B12
Vit. B12
Vitamin K
Vit. K
Folate
Folate
5.7%
0%
0%
7%
39%
66%
7.5%
11%
54%
0%
48%
41%
5
100 g
300 g
1 almond - 1.2g 1 oz (23 whole kernels) - 28.35g 1 cup, sliced - 92g 1 cup, ground - 95g 1 cup, slivered - 108g 1 cup, whole - 143g
Vitamin C
Vit. C
Vitamin D
Vit. D
Vitamin A
Vit. A
Vitamin E
Vit. E
Vitamin B1
Vit. B1
Vitamin B2
Vit. B2
Vitamin B3
Vit. B3
Vitamin B5
Vit. B5
Vitamin B6
Vit. B6
Vitamin B12
Vit. B12
Vitamin K
Vit. K
Folate
Folate
0%
0%
0%
513%
51%
263%
68%
28%
32%
0%
0%
33%
All nutrients comparison - raw data values
Nutrient
DV% diff.
Vitamin E
0.35mg
25.63mg
169%
Monounsaturated fat
1.981g
31.551g
74%
Copper
0.407mg
1.031mg
69%
Vitamin B2
0.285mg
1.138mg
66%
Fats
8.97g
49.93g
63%
Manganese
0.824mg
2.179mg
59%
Polyunsaturated fat
5.064g
12.329g
48%
Magnesium
86mg
270mg
44%
Phosphorus
245mg
481mg
34%
Fiber
6g
12.5g
26%
Calories
172kcal
579kcal
20%
Vitamin B3
0.399mg
3.618mg
20%
Iron
5.14mg
3.71mg
18%
Zinc
1.15mg
3.12mg
18%
Calcium
102mg
269mg
17%
Vitamin K
19.2µg
0µg
16%
Saturated fat
1.297g
3.802g
11%
Vitamin B6
0.234mg
0.137mg
7%
Protein
18.21g
21.15g
6%
Potassium
515mg
733mg
6%
Selenium
7.3µg
4.1µg
6%
Vitamin B5
0.179mg
0.471mg
6%
Carbs
8.36g
21.55g
4%
Vitamin B1
0.155mg
0.205mg
4%
Folate
54µg
44µg
3%
Vitamin C
1.7mg
0mg
2%
Choline
47.5mg
52.1mg
1%
Protein per 100 calories
11g
3.7g
N/A
Calories per 10 g protein
94kcal
274kcal
N/A
Weight per 100 calories
58g
17g
N/A
Unsaturated / Saturated Fat ratio
5.4
12
N/A
Net carbs
2.36g
9.05g
N/A
Sugar
3g
4.35g
N/A
Starch
0.72g
0%
Sodium
1mg
1mg
0%
Trans fat
0g
0.015g
N/A
Tryptophan
0.242mg
0.211mg
0%
Threonine
0.723mg
0.601mg
0%
Isoleucine
0.807mg
0.751mg
0%
Leucine
1.355mg
1.473mg
0%
Lysine
1.108mg
0.568mg
0%
Methionine
0.224mg
0.157mg
0%
Phenylalanine
0.869mg
1.132mg
0%
Valine
0.831mg
0.855mg
0%
Histidine
0.449mg
0.539mg
0%
Fructose
0.11g
0%
Omega-3 - ALA
0.003g
N/A
Omega-6 - Eicosadienoic acid
0.002g
N/A
Omega-6 - Linoleic acid
12.32g
N/A
Macronutrient Comparison
Macronutrient breakdown side-by-side comparison
1
18%
9%
8%
63%
2%
Protein:
18.21 g
Fats:
8.97 g
Carbs:
8.36 g
Water:
62.55 g
Other:
1.91 g
4
21%
50%
22%
4%
3%
Protein:
21.15 g
Fats:
49.93 g
Carbs:
21.55 g
Water:
4.41 g
Other:
2.96 g
Contains
more
Water Water
+1318.4%
Contains
more
Protein Protein
+16.1%
Contains
more
Fats Fats
+456.6%
Contains
more
Carbs Carbs
+157.8%
Contains
more
Other Other
+55%
Fat Type Comparison
Fat type breakdown side-by-side comparison
1
16%
24%
61%
Saturated fat:
Sat. Fat
1.297 g
Monounsaturated fat:
Mono. Fat
1.981 g
Polyunsaturated fat:
Poly. Fat
5.064 g
2
8%
66%
26%
Saturated fat:
Sat. Fat
3.802 g
Monounsaturated fat:
Mono. Fat
31.551 g
Polyunsaturated fat:
Poly. Fat
12.329 g
Contains
less
Sat. Fat Saturated fat
-65.9%
Contains
more
Mono. Fat Monounsaturated fat
+1492.7%
Contains
more
Poly. Fat Polyunsaturated fat
+143.5%