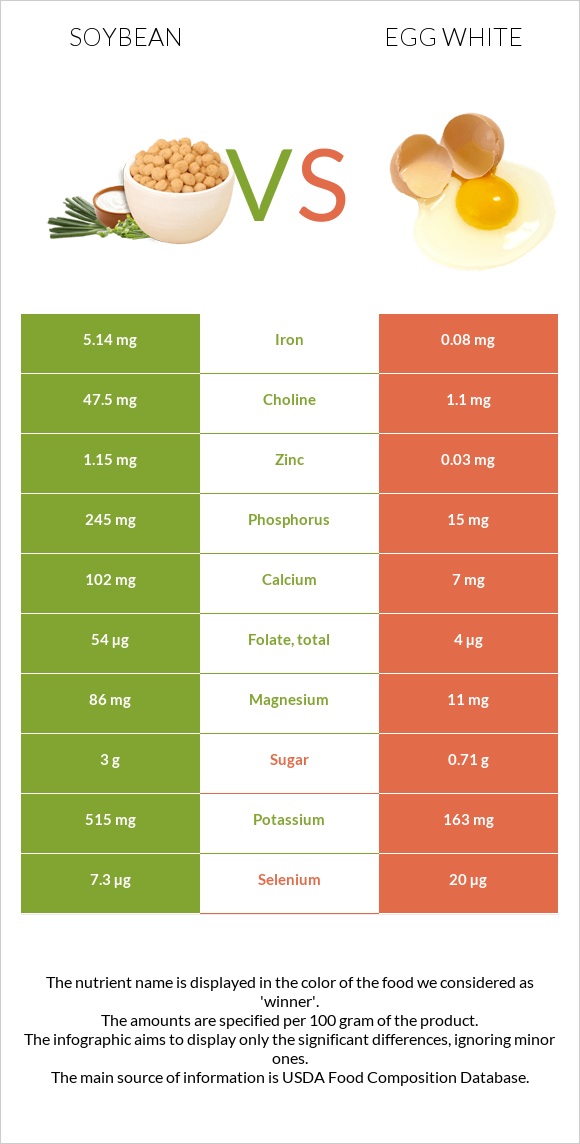
Summary of differences between soybeans and egg whites Soybeans have more iron, copper, manganese, phosphorus, fiber, magnesium, vitamin B6, vitamin K, and vitamin B1; however, egg whites are higher in selenium. Soybeans cover your daily need for iron, 63% more than egg whites. The glycemic index of soybeans is higher. These are the specific foods used in this comparison Soybeans, mature cooked, boiled, without salt and Egg, white, raw, fresh .
Infographic
Mineral Comparison
Mineral comparison score is based on the number of minerals by which one or the other food is richer. The "coverage" charts below show how much of the daily needs can be covered by 300 grams of the food.
9
100 g
300 g
1 tbsp - 10.7g 1 cup - 172g
Magnesium
Magnesium
Calcium
Calcium
Potassium
Potassium
Iron
Iron
Copper
Copper
Zinc
Zinc
Phosphorus
Phosphorus
Sodium
Sodium
Manganese
Manganese
Selenium
Selenium
61%
31%
45%
193%
136%
31%
105%
0.13%
107%
40%
1
100 g
300 g
1 large - 33g 1 cup - 243g
Magnesium
Magnesium
Calcium
Calcium
Potassium
Potassium
Iron
Iron
Copper
Copper
Zinc
Zinc
Phosphorus
Phosphorus
Sodium
Sodium
Manganese
Manganese
Selenium
Selenium
7.9%
2.1%
14%
3%
7.7%
0.82%
6.4%
22%
1.4%
109%
Vitamin Comparison
Vitamin comparison score is based on the number of vitamins by which one or the other food is richer. The "coverage" charts below show how much of the daily needs can be covered by 300 grams of the food.
7
100 g
300 g
1 tbsp - 10.7g 1 cup - 172g
Vitamin C
Vit. C
Vitamin D
Vit. D
Vitamin A
Vit. A
Vitamin E
Vit. E
Vitamin B1
Vit. B1
Vitamin B2
Vit. B2
Vitamin B3
Vit. B3
Vitamin B5
Vit. B5
Vitamin B6
Vit. B6
Vitamin B12
Vit. B12
Vitamin K
Vit. K
Folate
Folate
5.7%
0%
0%
7%
39%
66%
7.5%
11%
54%
0%
48%
41%
2
100 g
300 g
1 large - 33g 1 cup - 243g
Vitamin C
Vit. C
Vitamin D
Vit. D
Vitamin A
Vit. A
Vitamin E
Vit. E
Vitamin B1
Vit. B1
Vitamin B2
Vit. B2
Vitamin B3
Vit. B3
Vitamin B5
Vit. B5
Vitamin B6
Vit. B6
Vitamin B12
Vit. B12
Vitamin K
Vit. K
Folate
Folate
0%
0%
0%
0%
1%
101%
2%
11%
1.2%
11%
0%
3%
All nutrients comparison - raw data values
Nutrient
DV% diff.
Iron
5.14mg
0.08mg
63%
Copper
0.407mg
0.023mg
43%
Manganese
0.824mg
0.011mg
35%
Polyunsaturated fat
5.064g
0g
34%
Phosphorus
245mg
15mg
33%
Fiber
6g
0g
24%
Selenium
7.3µg
20µg
23%
Magnesium
86mg
11mg
18%
Vitamin B6
0.234mg
0.005mg
18%
Vitamin K
19.2µg
0µg
16%
Protein
18.21g
10.9g
15%
Fats
8.97g
0.17g
14%
Vitamin B1
0.155mg
0.004mg
13%
Folate
54µg
4µg
13%
Vitamin B2
0.285mg
0.439mg
12%
Calcium
102mg
7mg
10%
Potassium
515mg
163mg
10%
Zinc
1.15mg
0.03mg
10%
Choline
47.5mg
1.1mg
8%
Sodium
1mg
166mg
7%
Calories
172kcal
52kcal
6%
Saturated fat
1.297g
0g
6%
Monounsaturated fat
1.981g
0g
5%
Vitamin B12
0µg
0.09µg
4%
Carbs
8.36g
0.73g
3%
Vitamin C
1.7mg
0mg
2%
Vitamin E
0.35mg
0mg
2%
Vitamin B3
0.399mg
0.105mg
2%
Protein per 100 calories
11g
21g
N/A
Calories per 10 g protein
94kcal
48kcal
N/A
Weight per 100 calories
58g
192g
N/A
Unsaturated / Saturated Fat ratio
5.4
N/A
Net carbs
2.36g
0.73g
N/A
Sugar
3g
0.71g
N/A
Vitamin B5
0.179mg
0.19mg
0%
Tryptophan
0.242mg
0.125mg
0%
Threonine
0.723mg
0.449mg
0%
Isoleucine
0.807mg
0.661mg
0%
Leucine
1.355mg
1.016mg
0%
Lysine
1.108mg
0.806mg
0%
Methionine
0.224mg
0.399mg
0%
Phenylalanine
0.869mg
0.686mg
0%
Valine
0.831mg
0.809mg
0%
Histidine
0.449mg
0.29mg
0%
Fructose
0.07g
0%
Macronutrient Comparison
Macronutrient breakdown side-by-side comparison
4
18%
9%
8%
63%
2%
Protein:
18.21 g
Fats:
8.97 g
Carbs:
8.36 g
Water:
62.55 g
Other:
1.91 g
1
11%
88%
Protein:
10.9 g
Fats:
0.17 g
Carbs:
0.73 g
Water:
87.57 g
Other:
0.63 g
Contains
more
Protein Protein
+67.1%
Contains
more
Fats Fats
+5176.5%
Contains
more
Carbs Carbs
+1045.2%
Contains
more
Other Other
+203.2%
Contains
more
Water Water
+40%