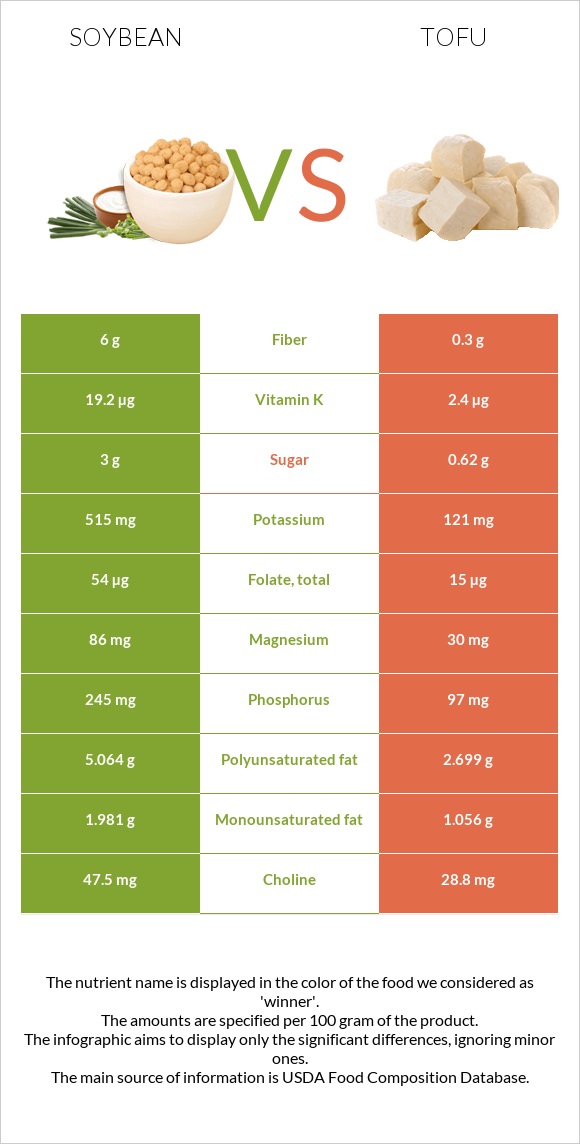
What are the main differences between soybeans and tofu? Soybeans are richer in copper, fiber, phosphorus, vitamin B2, vitamin B6, vitamin K, magnesium, potassium, and folate, while tofu is higher in calcium. Tofu's daily need coverage for calcium is 25% higher. Tofu has 20 times less fiber than soybeans. Soybeans have 6g of fiber, while tofu has 0.3g. We used Soybeans, mature cooked, boiled, without salt and Tofu, raw, regular, prepared with calcium sulfate types in this comparison.
Infographic
Mineral Comparison
Mineral comparison score is based on the number of minerals by which one or the other food is richer. The "coverage" charts below show how much of the daily needs can be covered by 300 grams of the food.
7
100 g
300 g
1 tbsp - 10.7g 1 cup - 172g
Magnesium
Magnesium
Calcium
Calcium
Potassium
Potassium
Iron
Iron
Copper
Copper
Zinc
Zinc
Phosphorus
Phosphorus
Sodium
Sodium
Manganese
Manganese
Selenium
Selenium
61%
31%
45%
193%
136%
31%
105%
0.13%
107%
40%
2
100 g
300 g
0.25 block - 116g 0.5 cup - 124g
Magnesium
Magnesium
Calcium
Calcium
Potassium
Potassium
Iron
Iron
Copper
Copper
Zinc
Zinc
Phosphorus
Phosphorus
Sodium
Sodium
Manganese
Manganese
Selenium
Selenium
21%
105%
11%
201%
64%
22%
42%
0.91%
79%
49%
Vitamin Comparison
Vitamin comparison score is based on the number of vitamins by which one or the other food is richer. The "coverage" charts below show how much of the daily needs can be covered by 300 grams of the food.
9
100 g
300 g
1 tbsp - 10.7g 1 cup - 172g
Vitamin C
Vit. C
Vitamin D
Vit. D
Vitamin A
Vit. A
Vitamin E
Vit. E
Vitamin B1
Vit. B1
Vitamin B2
Vit. B2
Vitamin B3
Vit. B3
Vitamin B5
Vit. B5
Vitamin B6
Vit. B6
Vitamin B12
Vit. B12
Vitamin K
Vit. K
Folate
Folate
5.7%
0%
0%
7%
39%
66%
7.5%
11%
54%
0%
48%
41%
0
100 g
300 g
0.25 block - 116g 0.5 cup - 124g
Vitamin C
Vit. C
Vitamin D
Vit. D
Vitamin A
Vit. A
Vitamin E
Vit. E
Vitamin B1
Vit. B1
Vitamin B2
Vit. B2
Vitamin B3
Vit. B3
Vitamin B5
Vit. B5
Vitamin B6
Vit. B6
Vitamin B12
Vit. B12
Vitamin K
Vit. K
Folate
Folate
0.33%
0%
0%
0.2%
20%
12%
3.7%
4.1%
11%
0%
6%
11%
All nutrients comparison - raw data values
Nutrient
DV% diff.
Calcium
102mg
350mg
25%
Copper
0.407mg
0.193mg
24%
Fiber
6g
0.3g
23%
Phosphorus
245mg
97mg
21%
Protein
18.21g
8.08g
20%
Vitamin B2
0.285mg
0.052mg
18%
Polyunsaturated fat
5.064g
2.699g
16%
Vitamin B6
0.234mg
0.047mg
14%
Vitamin K
19.2µg
2.4µg
14%
Magnesium
86mg
30mg
13%
Potassium
515mg
121mg
12%
Manganese
0.824mg
0.605mg
10%
Folate
54µg
15µg
10%
Fats
8.97g
4.78g
6%
Vitamin B1
0.155mg
0.081mg
6%
Calories
172kcal
76kcal
5%
Iron
5.14mg
5.36mg
3%
Zinc
1.15mg
0.8mg
3%
Selenium
7.3µg
8.9µg
3%
Choline
47.5mg
28.8mg
3%
Saturated fat
1.297g
0.691g
3%
Vitamin C
1.7mg
0.1mg
2%
Carbs
8.36g
1.87g
2%
Vitamin E
0.35mg
0.01mg
2%
Vitamin B5
0.179mg
0.068mg
2%
Monounsaturated fat
1.981g
1.056g
2%
Vitamin B3
0.399mg
0.195mg
1%
Protein per 100 calories
11g
11g
N/A
Calories per 10 g protein
94kcal
94kcal
N/A
Weight per 100 calories
58g
132g
N/A
Unsaturated / Saturated Fat ratio
5.4
5.4
N/A
Net carbs
2.36g
1.57g
N/A
Sugar
3g
0.62g
N/A
Sodium
1mg
7mg
0%
Tryptophan
0.242mg
0.12mg
0%
Threonine
0.723mg
0.402mg
0%
Isoleucine
0.807mg
0.435mg
0%
Leucine
1.355mg
0.713mg
0%
Lysine
1.108mg
0.452mg
0%
Methionine
0.224mg
0.108mg
0%
Phenylalanine
0.869mg
0.428mg
0%
Valine
0.831mg
0.446mg
0%
Histidine
0.449mg
0.221mg
0%
Macronutrient Comparison
Macronutrient breakdown side-by-side comparison
4
18%
9%
8%
63%
2%
Protein:
18.21 g
Fats:
8.97 g
Carbs:
8.36 g
Water:
62.55 g
Other:
1.91 g
1
8%
5%
2%
85%
Protein:
8.08 g
Fats:
4.78 g
Carbs:
1.87 g
Water:
84.55 g
Other:
0.72 g
Contains
more
Protein Protein
+125.4%
Contains
more
Fats Fats
+87.7%
Contains
more
Carbs Carbs
+347.1%
Contains
more
Other Other
+165.3%
Contains
more
Water Water
+35.2%
Fat Type Comparison
Fat type breakdown side-by-side comparison
2
16%
24%
61%
Saturated fat:
Sat. Fat
1.297 g
Monounsaturated fat:
Mono. Fat
1.981 g
Polyunsaturated fat:
Poly. Fat
5.064 g
1
16%
24%
61%
Saturated fat:
Sat. Fat
0.691 g
Monounsaturated fat:
Mono. Fat
1.056 g
Polyunsaturated fat:
Poly. Fat
2.699 g
Contains
more
Mono. Fat Monounsaturated fat
+87.6%
Contains
more
Poly. Fat Polyunsaturated fat
+87.6%
Contains
less
Sat. Fat Saturated fat
-46.7%