Soymilk (All flavors), lowfat, with added calcium, vitamins A and D vs. Soy sauce — In-Depth Nutrition Comparison
Compare
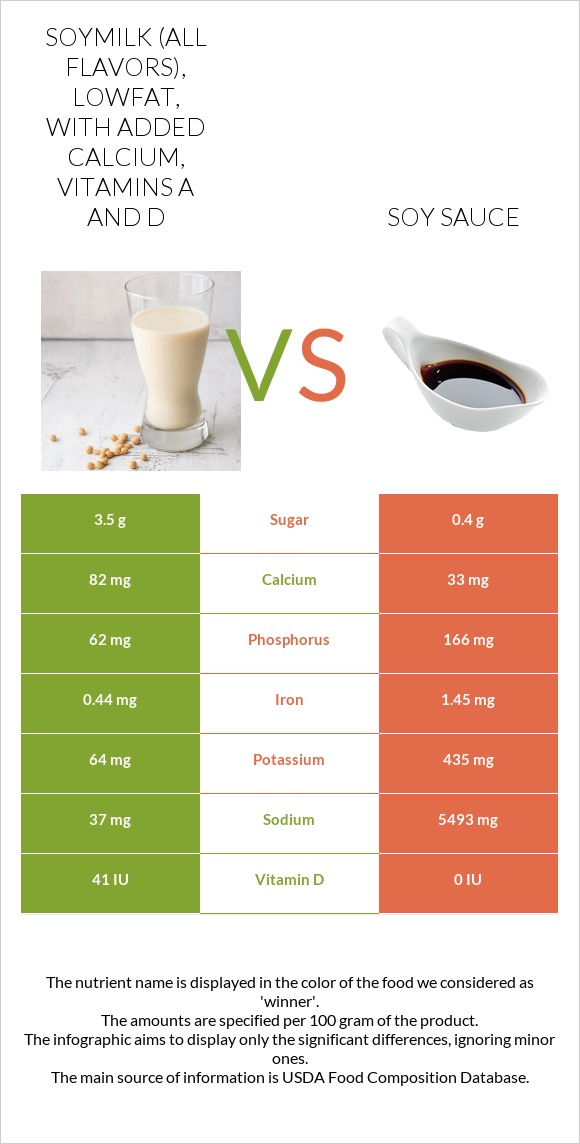
Important differences between soymilk (All flavors), lowfat, with added calcium, vitamins A and D and soy sauce
- Soymilk (All flavors), lowfat, with added calcium, vitamins A, and D has more vitamin D*; however, soy sauce has more phosphorus, iron, and potassium.
- Soy sauce's daily need coverage for sodium is 237% more.
- Soy sauce is lower in sugar.
The food varieties used in the comparison are Soymilk (All flavors), lowfat, with added calcium, vitamins A, and D and Soy sauce made from soy and wheat (shoyu).
Infographic
Infographic link
Mineral Comparison
Mineral comparison score is based on the number of minerals by which one or the other food is richer. The "coverage" charts below show how much of the daily needs can be covered by 300 grams of the food.
| Contains more CalciumCalcium | +148.5% |
| Contains less SodiumSodium | -99.3% |
| Contains more PotassiumPotassium | +579.7% |
| Contains more IronIron | +229.5% |
| Contains more PhosphorusPhosphorus | +167.7% |
Vitamin Comparison
Vitamin comparison score is based on the number of vitamins by which one or the other food is richer. The "coverage" charts below show how much of the daily needs can be covered by 300 grams of the food.
| Contains more Vitamin DVitamin D | +∞% |
| Contains more Vitamin AVitamin A | +∞% |
All nutrients comparison - raw data values
| Nutrient |  |
 |
DV% diff. |
| Sodium | 37mg | 5493mg | 237% |
| Manganese | 1.018mg | 44% | |
| Magnesium | 74mg | 18% | |
| Phosphorus | 62mg | 166mg | 15% |
| Vitamin B3 | 2.196mg | 14% | |
| Protein | 1.65g | 8.14g | 13% |
| Iron | 0.44mg | 1.45mg | 13% |
| Vitamin B2 | 0.165mg | 13% | |
| Potassium | 64mg | 435mg | 11% |
| Vitamin B6 | 0.148mg | 11% | |
| Zinc | 0.87mg | 8% | |
| Vitamin A | 62µg | 0µg | 7% |
| Vitamin B5 | 0.297mg | 6% | |
| Vitamin D* | 41 IU | 0 IU | 5% |
| Vitamin D | 1µg | 0µg | 5% |
| Calcium | 82mg | 33mg | 5% |
| Copper | 0.043mg | 5% | |
| Folate | 14µg | 4% | |
| Vitamin B1 | 0.033mg | 3% | |
| Choline | 18.3mg | 3% | |
| Calories | 43kcal | 53kcal | 1% |
| Carbs | 7.2g | 4.93g | 1% |
| Selenium | 0.5µg | 1% | |
| Polyunsaturated fat | 0.412g | 0.263g | 1% |
| Protein per 100 calories | 3.8g | 15g | N/A |
| Calories per 10 g protein | 261kcal | 65kcal | N/A |
| Weight per 100 calories | 233g | 189g | N/A |
| Fats | 0.62g | 0.57g | 0% |
| Net carbs | 6.4g | 4.13g | N/A |
| Sugar | 3.5g | 0.4g | N/A |
| Fiber | 0.8g | 0.8g | 0% |
| Saturated fat | 0g | 0.073g | 0% |
| Monounsaturated fat | 0.206g | 0.088g | 0% |
| Tryptophan | 0.096mg | 0% | |
| Threonine | 0.271mg | 0% | |
| Isoleucine | 0.318mg | 0% | |
| Leucine | 0.537mg | 0% | |
| Lysine | 0.381mg | 0% | |
| Methionine | 0.097mg | 0% | |
| Phenylalanine | 0.353mg | 0% | |
| Valine | 0.332mg | 0% | |
| Histidine | 0.174mg | 0% |
Macronutrient Comparison
Macronutrient breakdown side-by-side comparison
Protein:
1.65 g
Fats:
0.62 g
Carbs:
7.2 g
Water:
89.89 g
Other:
0.64 g
Protein:
8.14 g
Fats:
0.57 g
Carbs:
4.93 g
Water:
71.15 g
Other:
15.21 g
| Contains more CarbsCarbs | +46% |
| Contains more WaterWater | +26.3% |
| Contains more ProteinProtein | +393.3% |
| Contains more OtherOther | +2276.6% |
~equal in
Fats
~0.57g
Fat Type Comparison
Fat type breakdown side-by-side comparison
Saturated fat:
Sat. Fat
0 g
Monounsaturated fat:
Mono. Fat
0.206 g
Polyunsaturated fat:
Poly. Fat
0.412 g
Saturated fat:
Sat. Fat
0.073 g
Monounsaturated fat:
Mono. Fat
0.088 g
Polyunsaturated fat:
Poly. Fat
0.263 g
| Contains less Sat. FatSaturated fat | -100% |
| Contains more Mono. FatMonounsaturated fat | +134.1% |
| Contains more Poly. FatPolyunsaturated fat | +56.7% |