Soy sauce nutrition: calories, carbs, GI, protein, fiber, fats
Carbohydrates in Soy Sauce
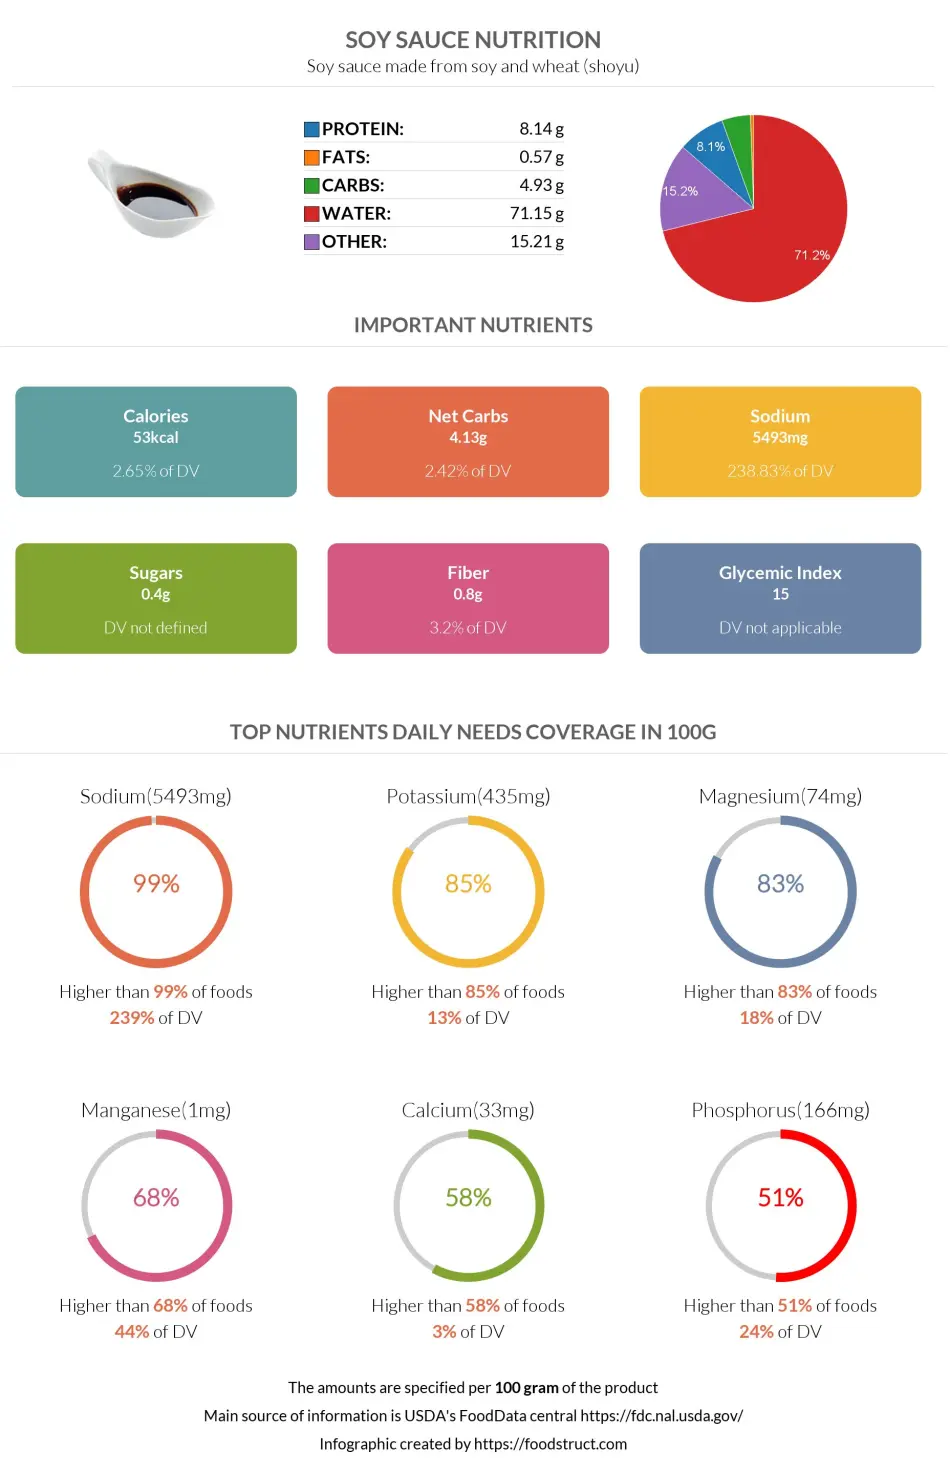
Soy sauce is a condiment made from soybeans and wheat. It is low in carbohydrates while being relatively higher in protein. However, it is not significantly rich in protein.
Soy sauce consists of 5% carbohydrates, 8% protein, 1% fat, 71% water, and 15% micronutrients, such as sodium.
Carbohydrates per 100g
A 100g serving of soy sauce, equalling 3.5 oz (103ml) or a little less than half a cup, contains 4.93g of carbohydrates.
Macronutrients chart
Soy sauce made from soybeans without wheat, known as tamari, is higher in carbohydrates, containing 5.57g in a 100g serving (1).
Carbohydrates per Serving Size
Soy sauce is more often used in smaller amounts. One average serving size of soy sauce per person is 1 tbsp, equal to 16g or ½ fl oz (15ml).
One tablespoon of soy sauce contains only 0.78g of carbohydrates.
Carbohydrate Breakdown
The carbohydrate content of soy sauce consists of 84% net carbs and only 16% dietary fiber.
Sugar Breakdown
Despite the net carb content, soy sauce contains only 0.4g of sugars, namely 0.1g of sucrose and 0.3g of glucose. The simple sugar composition is low.
Carbohydrate type breakdown
As a result of fermentation during production, soy sauce may instead contain sugar alcohols, also known as polyols (2). Sugar alcohol is a carbohydrate that adds a sweet flavor but provides fewer calories than sugar.
Comparison to Other Foods
Looking at the table below, you can see how the carbohydrate content of soy sauce compares to those of other foods.
| Food | Carbohydrates, per serving | Carbohydrates, per 100g |
| Soy Sauce | 1g (1tbsp or 16g) | 5g |
| Soybean | 56g (1 cup or 186g) | 30g |
| Hoisin Sauce | 7g (1tbsp or 16g) | 44g |
| Worcestershire Sauce | 3g (1tbsp or 16g) | 19g |
| Teriyaki Sauce | 3g (1tbsp or 16g) | 16g |
| Oyster Sauce | 2g (1tbsp or 16g) | 11g |
References
- https://fdc.nal.usda.gov/fdc-app.html#/food-details/174278/nutrients
- https://www.ncbi.nlm.nih.gov/pmc/articles/PMC7581291/

Top nutrition facts for Soy sauce
| Calories ⓘ Calories for selected serving | 53 kcal |
|
Glycemic index ⓘ
Source: Check out our full article on Soy sauce glycemic index Check out our Glycemic index chart page for the full list.
|
15 (low) |
| Glycemic load ⓘ Glycemic Load (GL) is a metric that measures both the quality (Glycemic Index) and quantity of carbohydrates in a specific serving of food to estimate its impact on blood sugar levels. It is calculated as: (GI × Carbs in grams) / 100. | 0 (low) |
| Net carbs ⓘ Net Carbs = Total Carbohydrates – Fiber – Sugar Alcohols | 4 g |
| Default serving size ⓘ Serving sizes are mostly taken from FDA's Reference Amounts Customarily Consumed (RACCs) | 1 tbsp (16 g) |
| Acidity (Based on PRAL) ⓘ PRAL (Potential renal acid load) is calculated using a formula. On the PRAL scale the higher the positive value, the more is the acidifying effect on the body. The lower the negative value, the higher the alkalinity of the food. 0 is neutral. | -1.4 (alkaline) |
| Oxalates | 11 mg ⓘ https://core.ac.uk/reader/38935472?utm_source=linkout |
Soy sauce calories (kcal)
| Calories for different serving sizes of soy sauce | Calories | Weight |
|---|---|---|
| Calories in 100 grams | 53 | |
| Calories in 1 tsp | 3 | 5.3 g |
| Calories in 1 individual packet | 5 | 8.9 g |
| Calories in 1 tbsp | 8 | 16 g |
| Calories in 1 cup | 135 | 255 g |
| Calories for different varieties of soy sauce | Calories | Weight |
|---|---|---|
| Soy sauce made from soy and wheat (shoyu) (this food) | 53 | 100 g |
| Soy sauce made from soy and wheat (shoyu), low sodium | 57 | 100 g |
| Soy sauce, reduced sodium, made from hydrolyzed vegetable protein | 90 | 100 g |
| Soybeans, green, cooked, boiled, drained, without salt | 141 | 100 g |
| Soybeans, green, cooked, boiled, drained, with salt | 141 | 100 g |
| Soybeans, green, raw | 147 | 100 g |
| Soybean, curd cheese | 151 | 100 g |
| Soybeans, mature seeds, cooked, boiled, with salt | 172 | 100 g |
| Soybeans, mature seeds, dry roasted | 449 | 100 g |
Extra Nutrition facts for Soy sauce
| Protein per 100 calories ⓘ Shows how many grams of protein you get from 100 calories of this food, calculated as (protein in g ÷ calories) × 100. | 15 g |
| Calories per 10 g protein ⓘ Shows how many calories you need to eat from this food to get 10 g of protein, calculated as (calories ÷ protein in g) × 10. | 65 kcal |
| Weight per 100 calories ⓘ Shows how many grams of this food equal 100 kcal—higher grams mean a larger portion for the same calories. | 189 g |
Soy sauce Glycemic index (GI)
Mineral coverage chart
Mineral chart - relative view
Vitamin coverage chart
Vitamin chart - relative view
Protein quality breakdown
Fat type information
Fiber content ratio for Soy sauce
All nutrients for Soy sauce per 100g
| Nutrient | Value | DV% | In TOP % of foods | Comparison |
| Vitamin A | 0µg | 0% | 100% | |
| Calories | 53kcal | 3% | 86% |
1.1 times more than Orange
|
| Weight per 100 calories | 189g | N/A | 15% | |
| Protein per 100 calories | 15g | N/A | 12% | |
| Protein | 8.1g | 19% | 50% |
2.9 times more than Broccoli
|
| Calories per 10 g protein | 65kcal | N/A | 85% | |
| Fats | 0.57g | 1% | 80% |
58.4 times less than Cheese
|
| Vitamin C | 0mg | 0% | 100% |
N/A
|
| Carbs | 4.9g | 2% | 61% |
5.7 times less than Rice
|
| Net carbs | 4.1g | N/A | 60% |
13.1 times less than Chocolate
|
| Cholesterol | 0mg | 0% | 100% |
N/A
|
| Vitamin D | 0µg | 0% | 100% |
N/A
|
| Vitamin D* | 0 IU | 0% | 100% |
N/A
|
| Magnesium | 74mg | 18% | 9% |
1.9 times less than Almonds
|
| Calcium | 33mg | 3% | 39% |
3.8 times less than Milk
|
| Potassium | 435mg | 13% | 11% |
3 times more than Cucumber
|
| Iron | 1.5mg | 18% | 48% |
1.8 times less than Beef broiled
|
| Sugar | 0.4g | N/A | 52% |
22.4 times less than Coca-Cola
|
| Fiber | 0.8g | 3% | 47% |
3 times less than Orange
|
| Copper | 0.04mg | 5% | 70% |
3.3 times less than Shiitake
|
| Zinc | 0.87mg | 8% | 49% |
7.3 times less than Beef broiled
|
| Phosphorus | 166mg | 24% | 42% |
1.1 times less than Chicken meat
|
| Sodium | 5493mg | 239% | 1% |
11.2 times more than White bread
|
| Vitamin E | 0mg | 0% | 100% |
N/A
|
| Manganese | 1mg | 44% | 8% | |
| Selenium | 0.5µg | 1% | 70% | |
| Vitamin B1 | 0.03mg | 3% | 74% |
8.1 times less than Pea raw
|
| Vitamin B2 | 0.17mg | 13% | 48% |
1.3 times more than Avocado
|
| Vitamin B3 | 2.2mg | 14% | 50% |
4.4 times less than Turkey meat
|
| Vitamin B5 | 0.3mg | 6% | 49% |
3.8 times less than Sunflower seeds
|
| Vitamin B6 | 0.15mg | 11% | 46% |
1.2 times more than Oats
|
| Vitamin B12 | 0µg | 0% | 100% |
N/A
|
| Vitamin K | 0µg | 0% | 100% |
N/A
|
| Folate | 14µg | 4% | 41% |
4.4 times less than Brussels sprouts
|
| Trans fat | 0g | N/A | 100% |
N/A
|
| Saturated fat | 0.07g | 0% | 80% |
80.8 times less than Beef broiled
|
| Choline | 18mg | 3% | 31% | |
| Monounsaturated fat | 0.09g | N/A | 75% |
111.4 times less than Avocado
|
| Polyunsaturated fat | 0.26g | N/A | 67% |
179.4 times less than Walnut
|
| Tryptophan | 0.1mg | 0% | 38% |
3.2 times less than Chicken meat
|
| Threonine | 0.27mg | 0% | 39% |
2.7 times less than Beef broiled
|
| Isoleucine | 0.32mg | 0% | 39% |
2.9 times less than Salmon raw
|
| Leucine | 0.54mg | 0% | 40% |
4.5 times less than Tuna Bluefin
|
| Lysine | 0.38mg | 0% | 38% |
1.2 times less than Tofu
|
| Methionine | 0.1mg | 0% | 43% |
Equal to Quinoa
|
| Phenylalanine | 0.35mg | 0% | 40% |
1.9 times less than Egg
|
| Valine | 0.33mg | 0% | 41% |
6.1 times less than Soybean raw
|
| Histidine | 0.17mg | 0% | 40% |
4.3 times less than Turkey meat
|
| Fructose | 0g | 0% | 100% |
N/A
|
| Caffeine | 0mg | 0% | 100% | |
| Omega-3 - EPA | 0g | N/A | 100% |
N/A
|
| Omega-3 - DHA | 0g | N/A | 100% |
N/A
|
| Omega-3 - DPA | 0g | N/A | 100% |
N/A
|
Check out similar food or compare with current
NUTRITION FACTS LABEL
Serving Size ______________
Health checks
Soy sauce nutrition infographic
References
All the values for which the sources are not specified explicitly are taken from FDA’s Food Central. The exact link to the food presented on this page can be found below.