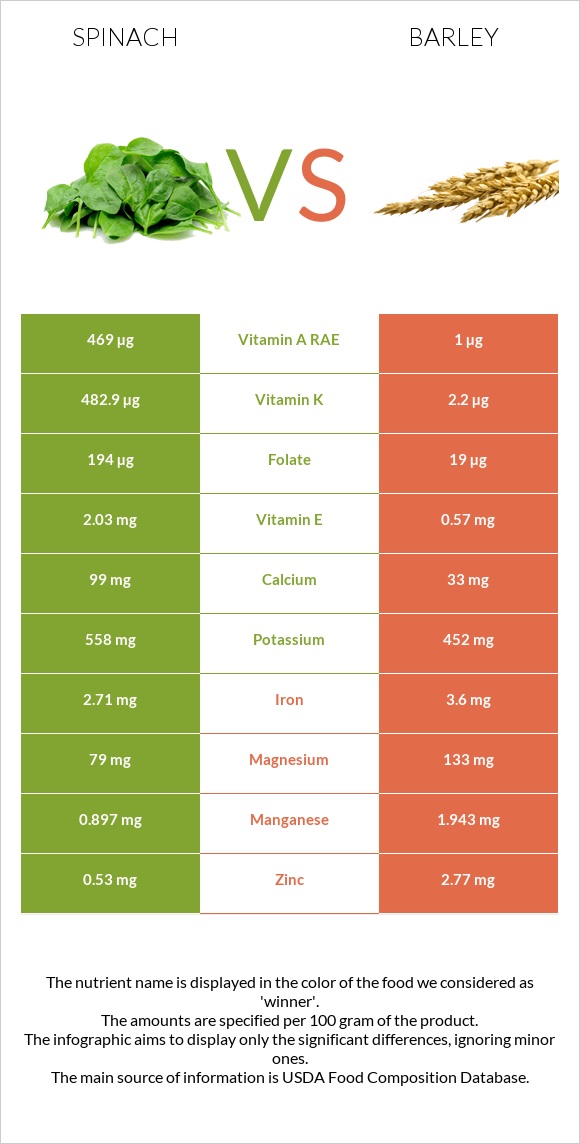
The main differences between spinach and barley Spinach is richer in vitamin K, vitamin A, folate, manganese, iron, magnesium, vitamin E, vitamin B2, and calcium, yet barley is richer in selenium. Daily need coverage for vitamin K for spinach is 411% higher. Spinach contains 1497 times more vitamin A than barley. Spinach contains 10481 IU of vitamin A, while barley contains 7 IU. Food types used in this article are Spinach, cooked, boiled, drained, without salt and Barley, pearled, cooked .
Infographic
Mineral Comparison
Mineral comparison score is based on the number of minerals by which one or the other food is richer. The "coverage" charts below show how much of the daily needs can be covered by 300 grams of the food.
6
100 g
300 g
1 cup - 180g
Magnesium
Magnesium
Calcium
Calcium
Potassium
Potassium
Iron
Iron
Copper
Copper
Zinc
Zinc
Phosphorus
Phosphorus
Sodium
Sodium
Manganese
Manganese
Selenium
Selenium
62%
41%
41%
134%
58%
21%
24%
9.1%
122%
8.2%
2
100 g
300 g
1 cup - 157g
Magnesium
Magnesium
Calcium
Calcium
Potassium
Potassium
Iron
Iron
Copper
Copper
Zinc
Zinc
Phosphorus
Phosphorus
Sodium
Sodium
Manganese
Manganese
Selenium
Selenium
16%
3.3%
8.2%
50%
35%
22%
23%
0.39%
34%
47%
Vitamin Comparison
Vitamin comparison score is based on the number of vitamins by which one or the other food is richer. The "coverage" charts below show how much of the daily needs can be covered by 300 grams of the food.
8
100 g
300 g
1 cup - 180g
Vitamin C
Vit. C
Vitamin D
Vit. D
Vitamin A
Vit. A
Vitamin E
Vit. E
Vitamin B1
Vit. B1
Vitamin B2
Vit. B2
Vitamin B3
Vit. B3
Vitamin B5
Vit. B5
Vitamin B6
Vit. B6
Vitamin B12
Vit. B12
Vitamin K
Vit. K
Folate
Folate
33%
0%
175%
42%
24%
54%
9.2%
8.7%
56%
0%
1234%
110%
1
100 g
300 g
1 cup - 157g
Vitamin C
Vit. C
Vitamin D
Vit. D
Vitamin A
Vit. A
Vitamin E
Vit. E
Vitamin B1
Vit. B1
Vitamin B2
Vit. B2
Vitamin B3
Vit. B3
Vitamin B5
Vit. B5
Vitamin B6
Vit. B6
Vitamin B12
Vit. B12
Vitamin K
Vit. K
Folate
Folate
0%
0%
0%
0.2%
21%
14%
39%
8.1%
27%
0%
2%
12%
All nutrients comparison - raw data values
Nutrient
DV% diff.
Vitamin K
493.6µg
0.8µg
411%
Vitamin A
524µg
0µg
58%
Folate
146µg
16µg
33%
Manganese
0.935mg
0.259mg
29%
Iron
3.57mg
1.33mg
28%
Magnesium
87mg
22mg
15%
Vitamin E
2.08mg
0.01mg
14%
Calcium
136mg
11mg
13%
Selenium
1.5µg
8.6µg
13%
Vitamin B2
0.236mg
0.062mg
13%
Vitamin C
9.8mg
0mg
11%
Potassium
466mg
93mg
11%
Vitamin B3
0.49mg
2.063mg
10%
Vitamin B6
0.242mg
0.115mg
10%
Carbs
3.75g
28.22g
8%
Copper
0.174mg
0.105mg
8%
Fiber
2.4g
3.8g
6%
Calories
23kcal
123kcal
5%
Sodium
70mg
3mg
3%
Protein
2.97g
2.26g
1%
Zinc
0.76mg
0.82mg
1%
Vitamin B1
0.095mg
0.083mg
1%
Choline
19.7mg
13.4mg
1%
Polyunsaturated fat
0.109g
0.214g
1%
Protein per 100 calories
13g
1.8g
N/A
Calories per 10 g protein
77kcal
544kcal
N/A
Weight per 100 calories
435g
81g
N/A
Fats
0.26g
0.44g
0%
Net carbs
1.35g
24.42g
N/A
Sugar
0.43g
0.28g
N/A
Phosphorus
56mg
54mg
0%
Vitamin B5
0.145mg
0.135mg
0%
Saturated fat
0.043g
0.093g
0%
Monounsaturated fat
0.006g
0.057g
0%
Tryptophan
0.04mg
0.038mg
0%
Threonine
0.127mg
0.077mg
0%
Isoleucine
0.152mg
0.083mg
0%
Leucine
0.231mg
0.154mg
0%
Lysine
0.182mg
0.084mg
0%
Methionine
0.055mg
0.043mg
0%
Phenylalanine
0.134mg
0.127mg
0%
Valine
0.168mg
0.111mg
0%
Histidine
0.066mg
0.051mg
0%
Macronutrient Comparison
Macronutrient breakdown side-by-side comparison
3
3%
4%
91%
2%
Protein:
2.97 g
Fats:
0.26 g
Carbs:
3.75 g
Water:
91.21 g
Other:
1.81 g
2
2%
28%
69%
Protein:
2.26 g
Fats:
0.44 g
Carbs:
28.22 g
Water:
68.8 g
Other:
0.28 g
Contains
more
Protein Protein
+31.4%
Contains
more
Water Water
+32.6%
Contains
more
Other Other
+546.4%
Contains
more
Fats Fats
+69.2%
Contains
more
Carbs Carbs
+652.5%
Fat Type Comparison
Fat type breakdown side-by-side comparison
1
27%
4%
69%
Saturated fat:
Sat. Fat
0.043 g
Monounsaturated fat:
Mono. Fat
0.006 g
Polyunsaturated fat:
Poly. Fat
0.109 g
2
26%
16%
59%
Saturated fat:
Sat. Fat
0.093 g
Monounsaturated fat:
Mono. Fat
0.057 g
Polyunsaturated fat:
Poly. Fat
0.214 g
Contains
less
Sat. Fat Saturated fat
-53.8%
Contains
more
Mono. Fat Monounsaturated fat
+850%
Contains
more
Poly. Fat Polyunsaturated fat
+96.3%