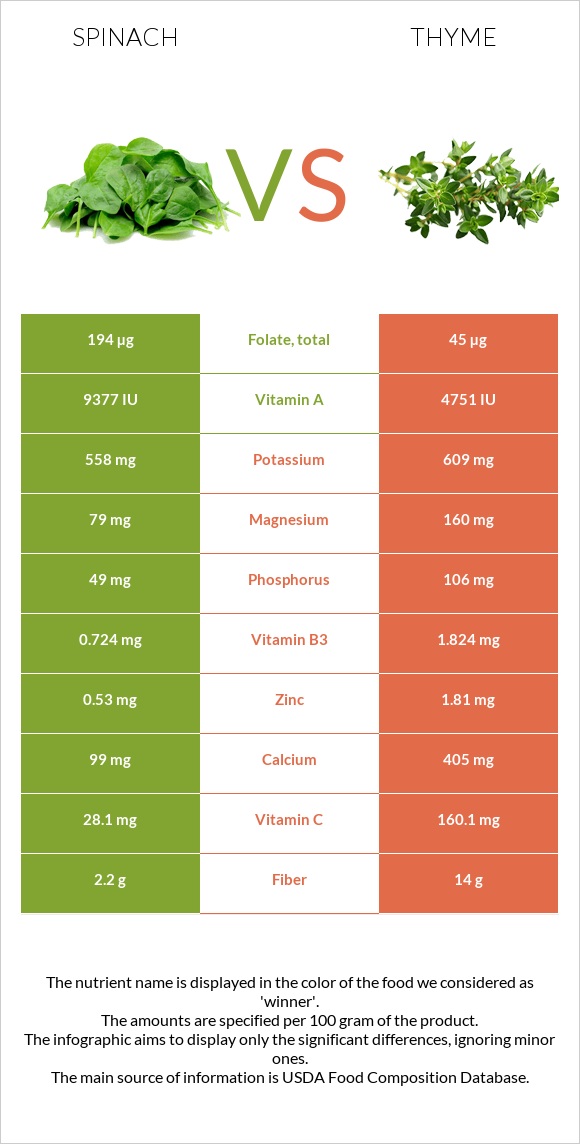
What are the differences between spinach and thyme? Spinach is higher in vitamin A and folate; however, thyme is richer in iron, vitamin C, fiber, copper, manganese, calcium, vitamin B2, and magnesium. Thyme's daily need coverage for iron is 174% more. Thyme contains 3 times less folate than spinach. Spinach contains 146µg of folate, while thyme contains 45µg. Spinach has a lower glycemic index (32) than thyme (45). We used Spinach, cooked, boiled, drained, without salt and Thyme, fresh types in this article.
Infographic
Mineral Comparison
Mineral comparison score is based on the number of minerals by which one or the other food is richer. The "coverage" charts below show how much of the daily needs can be covered by 300 grams of the food.
1
100 g
300 g
1 cup - 180g
Magnesium
Magnesium
Calcium
Calcium
Potassium
Potassium
Iron
Iron
Copper
Copper
Zinc
Zinc
Phosphorus
Phosphorus
Sodium
Sodium
Manganese
Manganese
Selenium
Selenium
62%
41%
41%
134%
58%
21%
24%
9.1%
122%
8.2%
9
100 g
300 g
0.5 tsp - 0.4g 1 tsp - 0.8g
Magnesium
Magnesium
Calcium
Calcium
Potassium
Potassium
Iron
Iron
Copper
Copper
Zinc
Zinc
Phosphorus
Phosphorus
Sodium
Sodium
Manganese
Manganese
Selenium
Selenium
114%
122%
54%
654%
185%
49%
45%
1.2%
224%
0%
Vitamin Comparison
Vitamin comparison score is based on the number of vitamins by which one or the other food is richer. The "coverage" charts below show how much of the daily needs can be covered by 300 grams of the food.
5
100 g
300 g
1 cup - 180g
Vitamin C
Vit. C
Vitamin D
Vit. D
Vitamin A
Vit. A
Vitamin E
Vit. E
Vitamin B1
Vit. B1
Vitamin B2
Vit. B2
Vitamin B3
Vit. B3
Vitamin B5
Vit. B5
Vitamin B6
Vit. B6
Vitamin B12
Vit. B12
Vitamin K
Vit. K
Folate
Folate
33%
0%
175%
42%
24%
54%
9.2%
8.7%
56%
0%
1234%
110%
5
100 g
300 g
0.5 tsp - 0.4g 1 tsp - 0.8g
Vitamin C
Vit. C
Vitamin D
Vit. D
Vitamin A
Vit. A
Vitamin E
Vit. E
Vitamin B1
Vit. B1
Vitamin B2
Vit. B2
Vitamin B3
Vit. B3
Vitamin B5
Vit. B5
Vitamin B6
Vit. B6
Vitamin B12
Vit. B12
Vitamin K
Vit. K
Folate
Folate
534%
0%
79%
0%
12%
109%
34%
25%
80%
0%
0%
34%
All nutrients comparison - raw data values
Nutrient
DV% diff.
Vitamin K
493.6µg
411%
Iron
3.57mg
17.45mg
174%
Vitamin C
9.8mg
160.1mg
167%
Fiber
2.4g
14g
46%
Copper
0.174mg
0.555mg
42%
Manganese
0.935mg
1.719mg
34%
Vitamin A
524µg
238µg
32%
Calcium
136mg
405mg
27%
Folate
146µg
45µg
25%
Vitamin B2
0.236mg
0.471mg
18%
Magnesium
87mg
160mg
17%
Vitamin E
2.08mg
14%
Zinc
0.76mg
1.81mg
10%
Vitamin B3
0.49mg
1.824mg
8%
Vitamin B6
0.242mg
0.348mg
8%
Carbs
3.75g
24.45g
7%
Phosphorus
56mg
106mg
7%
Protein
2.97g
5.56g
5%
Vitamin B5
0.145mg
0.409mg
5%
Calories
23kcal
101kcal
4%
Potassium
466mg
609mg
4%
Vitamin B1
0.095mg
0.048mg
4%
Choline
19.7mg
4%
Sodium
70mg
9mg
3%
Selenium
1.5µg
3%
Polyunsaturated fat
0.109g
0.532g
3%
Fats
0.26g
1.68g
2%
Saturated fat
0.043g
0.467g
2%
Protein per 100 calories
13g
5.5g
N/A
Calories per 10 g protein
77kcal
182kcal
N/A
Weight per 100 calories
435g
99g
N/A
Net carbs
1.35g
10.45g
N/A
Sugar
0.43g
N/A
Monounsaturated fat
0.006g
0.081g
0%
Tryptophan
0.04mg
0.114mg
0%
Threonine
0.127mg
0.154mg
0%
Isoleucine
0.152mg
0.285mg
0%
Leucine
0.231mg
0.262mg
0%
Lysine
0.182mg
0.126mg
0%
Methionine
0.055mg
0%
Phenylalanine
0.134mg
0%
Valine
0.168mg
0.307mg
0%
Histidine
0.066mg
0%
Macronutrient Comparison
Macronutrient breakdown side-by-side comparison
1
3%
4%
91%
2%
Protein:
2.97 g
Fats:
0.26 g
Carbs:
3.75 g
Water:
91.21 g
Other:
1.81 g
4
6%
2%
24%
65%
3%
Protein:
5.56 g
Fats:
1.68 g
Carbs:
24.45 g
Water:
65.11 g
Other:
3.2 g
Contains
more
Water Water
+40.1%
Contains
more
Protein Protein
+87.2%
Contains
more
Fats Fats
+546.2%
Contains
more
Carbs Carbs
+552%
Contains
more
Other Other
+76.8%
Fat Type Comparison
Fat type breakdown side-by-side comparison
1
27%
4%
69%
Saturated fat:
Sat. Fat
0.043 g
Monounsaturated fat:
Mono. Fat
0.006 g
Polyunsaturated fat:
Poly. Fat
0.109 g
2
43%
8%
49%
Saturated fat:
Sat. Fat
0.467 g
Monounsaturated fat:
Mono. Fat
0.081 g
Polyunsaturated fat:
Poly. Fat
0.532 g
Contains
less
Sat. Fat Saturated fat
-90.8%
Contains
more
Mono. Fat Monounsaturated fat
+1250%
Contains
more
Poly. Fat Polyunsaturated fat
+388.1%