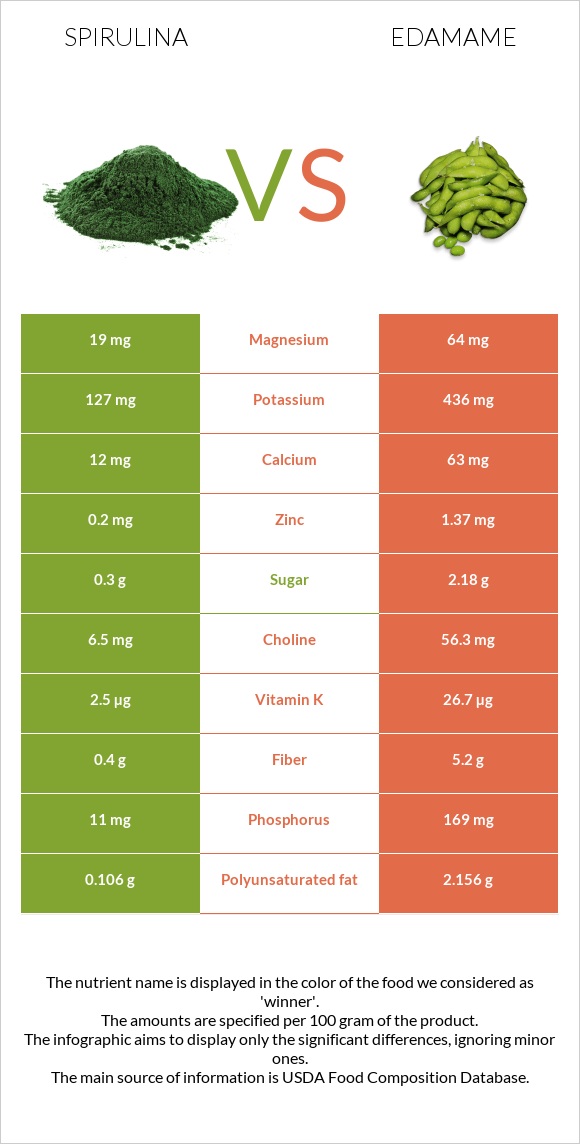
How are spirulina and edamame different? Spirulina is richer in copper and vitamin B2, while edamame is higher in folate, manganese, phosphorus, vitamin K, fiber, magnesium, zinc, and potassium. Edamame covers your daily need for folate, 76% more than spirulina. Spirulina contains 2 times more vitamin B2 than edamame. Spirulina contains 0.342mg of vitamin B2, while edamame contains 0.155mg. Seaweed, spirulina, raw and Edamame, frozen, prepared types were used in this article.
Infographic
Mineral Comparison
Mineral comparison score is based on the number of minerals by which one or the other food is richer. The "coverage" charts below show how much of the daily needs can be covered by 300 grams of the food.
2
100 g
300 g
Magnesium
Magnesium
Calcium
Calcium
Potassium
Potassium
Iron
Iron
Copper
Copper
Zinc
Zinc
Phosphorus
Phosphorus
Sodium
Sodium
Manganese
Manganese
Selenium
Selenium
14%
3.6%
11%
105%
199%
5.5%
4.7%
13%
24%
3.8%
8
100 g
300 g
1 cup - 155g
Magnesium
Magnesium
Calcium
Calcium
Potassium
Potassium
Iron
Iron
Copper
Copper
Zinc
Zinc
Phosphorus
Phosphorus
Sodium
Sodium
Manganese
Manganese
Selenium
Selenium
46%
19%
38%
85%
115%
37%
72%
0.78%
134%
4.4%
Vitamin Comparison
Vitamin comparison score is based on the number of vitamins by which one or the other food is richer. The "coverage" charts below show how much of the daily needs can be covered by 300 grams of the food.
2
100 g
300 g
Vitamin C
Vit. C
Vitamin D
Vit. D
Vitamin A
Vit. A
Vitamin E
Vit. E
Vitamin B1
Vit. B1
Vitamin B2
Vit. B2
Vitamin B3
Vit. B3
Vitamin B5
Vit. B5
Vitamin B6
Vit. B6
Vitamin B12
Vit. B12
Vitamin K
Vit. K
Folate
Folate
3%
0%
1%
9.8%
56%
79%
22%
20%
7.8%
0%
6.3%
6.8%
7
100 g
300 g
1 cup - 155g
Vitamin C
Vit. C
Vitamin D
Vit. D
Vitamin A
Vit. A
Vitamin E
Vit. E
Vitamin B1
Vit. B1
Vitamin B2
Vit. B2
Vitamin B3
Vit. B3
Vitamin B5
Vit. B5
Vitamin B6
Vit. B6
Vitamin B12
Vit. B12
Vitamin K
Vit. K
Folate
Folate
20%
0%
5%
14%
50%
36%
17%
24%
23%
0%
67%
233%
All nutrients comparison - raw data values
Nutrient
DV% diff.
Folate
9µg
311µg
76%
Manganese
0.186mg
1.024mg
36%
Copper
0.597mg
0.345mg
28%
Phosphorus
11mg
169mg
23%
Vitamin K
2.5µg
26.7µg
20%
Fiber
0.4g
5.2g
19%
Vitamin B2
0.342mg
0.155mg
14%
Polyunsaturated fat
0.106g
2.156g
14%
Protein
5.92g
11.91g
12%
Magnesium
19mg
64mg
11%
Zinc
0.2mg
1.37mg
11%
Potassium
127mg
436mg
9%
Choline
6.5mg
56.3mg
9%
Fats
0.39g
5.2g
7%
Iron
2.79mg
2.27mg
7%
Vitamin C
0.9mg
6.1mg
6%
Calories
26kcal
121kcal
5%
Calcium
12mg
63mg
5%
Vitamin B6
0.034mg
0.1mg
5%
Sodium
98mg
6mg
4%
Monounsaturated fat
0.034g
1.282g
3%
Carbs
2.42g
8.91g
2%
Vitamin B1
0.222mg
0.2mg
2%
Vitamin B3
1.196mg
0.915mg
2%
Saturated fat
0.135g
0.62g
2%
Starch
1.51g
1%
Vitamin A
3µg
15µg
1%
Vitamin E
0.49mg
0.68mg
1%
Vitamin B5
0.325mg
0.395mg
1%
Protein per 100 calories
23g
9.8g
N/A
Calories per 10 g protein
44kcal
102kcal
N/A
Weight per 100 calories
385g
83g
N/A
Unsaturated / Saturated Fat ratio
1
5.5
N/A
Net carbs
2.02g
3.71g
N/A
Sugar
0.3g
2.18g
N/A
Selenium
0.7µg
0.8µg
0%
Trans fat
0g
0.009g
N/A
Tryptophan
0.096mg
0.126mg
0%
Threonine
0.306mg
0.331mg
0%
Isoleucine
0.331mg
0.3mg
0%
Leucine
0.509mg
0.745mg
0%
Lysine
0.312mg
0.745mg
0%
Methionine
0.118mg
0.141mg
0%
Phenylalanine
0.286mg
0.488mg
0%
Valine
0.362mg
0.324mg
0%
Histidine
0.112mg
0.267mg
0%
Fructose
0.12g
0%
Omega-3 - EPA
0.003g
N/A
Omega-3 - ALA
0.358g
N/A
Omega-6 - Eicosadienoic acid
0.002g
N/A
Omega-6 - Linoleic acid
1.789g
N/A
Macronutrient Comparison
Macronutrient breakdown side-by-side comparison
1
6%
2%
91%
Protein:
5.92 g
Fats:
0.39 g
Carbs:
2.42 g
Water:
90.67 g
Other:
0.6 g
4
12%
5%
9%
73%
Protein:
11.91 g
Fats:
5.2 g
Carbs:
8.91 g
Water:
72.77 g
Other:
1.21 g
Contains
more
Water Water
+24.6%
Contains
more
Protein Protein
+101.2%
Contains
more
Fats Fats
+1233.3%
Contains
more
Carbs Carbs
+268.2%
Contains
more
Other Other
+101.7%
Fat Type Comparison
Fat type breakdown side-by-side comparison
1
49%
12%
39%
Saturated fat:
Sat. Fat
0.135 g
Monounsaturated fat:
Mono. Fat
0.034 g
Polyunsaturated fat:
Poly. Fat
0.106 g
2
15%
32%
53%
Saturated fat:
Sat. Fat
0.62 g
Monounsaturated fat:
Mono. Fat
1.282 g
Polyunsaturated fat:
Poly. Fat
2.156 g
Contains
less
Sat. Fat Saturated fat
-78.2%
Contains
more
Mono. Fat Monounsaturated fat
+3670.6%
Contains
more
Poly. Fat Polyunsaturated fat
+1934%