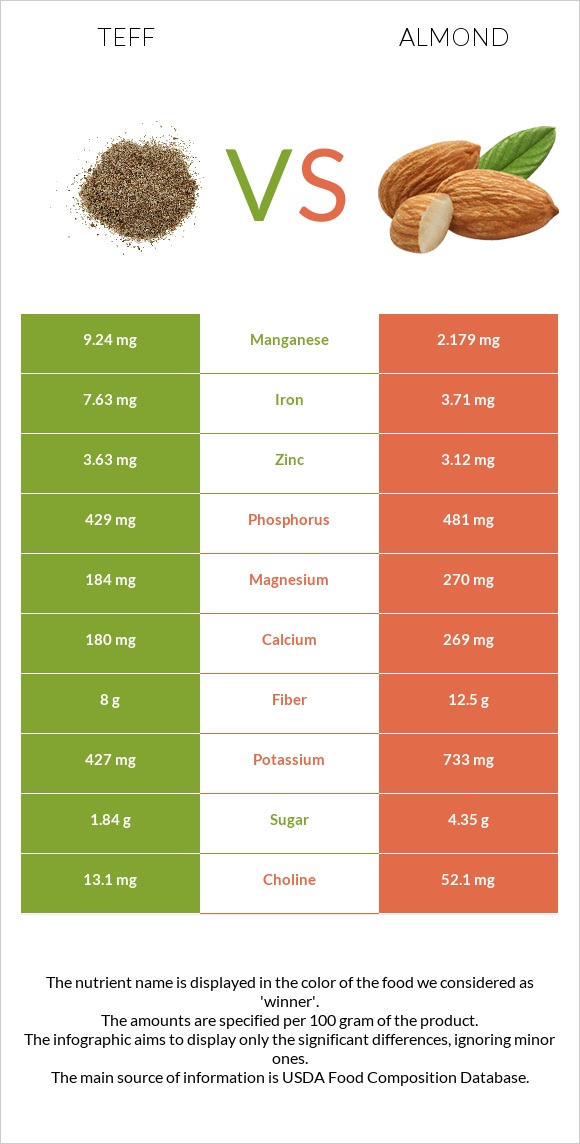
Summary of differences between teff and almonds Teff has more manganese, iron, vitamin B6, and vitamin B1, while almonds have more vitamin E, vitamin B2, copper, magnesium, and fiber. Teff covers your daily need for manganese, 307% more than almonds. Teff contains 4 times more vitamin B6 than almonds. While teff contains 0.482mg of vitamin B6, almonds contain only 0.137mg. The amount of saturated fat in teff is lower. These are the specific foods used in this comparison Teff, uncooked and Nuts, almonds .
Infographic
Mineral Comparison
Mineral comparison score is based on the number of minerals by which one or the other food is richer. The "coverage" charts below show how much of the daily needs can be covered by 300 grams of the food.
3
100 g
300 g
1 cup - 193g
Magnesium
Magnesium
Calcium
Calcium
Potassium
Potassium
Iron
Iron
Copper
Copper
Zinc
Zinc
Phosphorus
Phosphorus
Sodium
Sodium
Manganese
Manganese
Selenium
Selenium
131%
54%
38%
286%
270%
99%
184%
1.6%
1205%
24%
6
100 g
300 g
1 almond - 1.2g 1 oz (23 whole kernels) - 28.35g 1 cup, sliced - 92g 1 cup, ground - 95g 1 cup, slivered - 108g 1 cup, whole - 143g
Magnesium
Magnesium
Calcium
Calcium
Potassium
Potassium
Iron
Iron
Copper
Copper
Zinc
Zinc
Phosphorus
Phosphorus
Sodium
Sodium
Manganese
Manganese
Selenium
Selenium
193%
81%
65%
139%
344%
85%
206%
0.13%
284%
22%
Vitamin Comparison
Vitamin comparison score is based on the number of vitamins by which one or the other food is richer. The "coverage" charts below show how much of the daily needs can be covered by 300 grams of the food.
4
100 g
300 g
1 cup - 193g
Vitamin C
Vit. C
Vitamin D
Vit. D
Vitamin A
Vit. A
Vitamin E
Vit. E
Vitamin B1
Vit. B1
Vitamin B2
Vit. B2
Vitamin B3
Vit. B3
Vitamin B5
Vit. B5
Vitamin B6
Vit. B6
Vitamin B12
Vit. B12
Vitamin K
Vit. K
Folate
Folate
0%
0%
0%
1.6%
98%
62%
63%
57%
111%
0%
4.8%
0%
3
100 g
300 g
1 almond - 1.2g 1 oz (23 whole kernels) - 28.35g 1 cup, sliced - 92g 1 cup, ground - 95g 1 cup, slivered - 108g 1 cup, whole - 143g
Vitamin C
Vit. C
Vitamin D
Vit. D
Vitamin A
Vit. A
Vitamin E
Vit. E
Vitamin B1
Vit. B1
Vitamin B2
Vit. B2
Vitamin B3
Vit. B3
Vitamin B5
Vit. B5
Vitamin B6
Vit. B6
Vitamin B12
Vit. B12
Vitamin K
Vit. K
Folate
Folate
0%
0%
0%
513%
51%
263%
68%
28%
32%
0%
0%
33%
All nutrients comparison - raw data values
Nutrient
DV% diff.
Manganese
9.24mg
2.179mg
307%
Vitamin E
0.08mg
25.63mg
170%
Monounsaturated fat
0.589g
31.551g
77%
Polyunsaturated fat
1.071g
12.329g
75%
Fats
2.38g
49.93g
73%
Vitamin B2
0.27mg
1.138mg
67%
Iron
7.63mg
3.71mg
49%
Vitamin B6
0.482mg
0.137mg
27%
Copper
0.81mg
1.031mg
25%
Magnesium
184mg
270mg
20%
Fiber
8g
12.5g
18%
Carbs
73.13g
21.55g
17%
Protein
13.3g
21.15g
16%
Starch
36.56g
0.72g
15%
Vitamin B1
0.39mg
0.205mg
15%
Saturated fat
0.449g
3.802g
15%
Calories
367kcal
579kcal
11%
Folate
44µg
11%
Calcium
180mg
269mg
9%
Potassium
427mg
733mg
9%
Vitamin B5
0.942mg
0.471mg
9%
Phosphorus
429mg
481mg
7%
Choline
13.1mg
52.1mg
7%
Zinc
3.63mg
3.12mg
5%
Vitamin B3
3.363mg
3.618mg
2%
Vitamin K
1.9µg
0µg
2%
Selenium
4.4µg
4.1µg
1%
Protein per 100 calories
3.6g
3.7g
N/A
Calories per 10 g protein
276kcal
274kcal
N/A
Weight per 100 calories
27g
17g
N/A
Unsaturated / Saturated Fat ratio
3.7
12
N/A
Net carbs
65.13g
9.05g
N/A
Sugar
1.84g
4.35g
N/A
Sodium
12mg
1mg
0%
Trans fat
0.015g
N/A
Tryptophan
0.139mg
0.211mg
0%
Threonine
0.51mg
0.601mg
0%
Isoleucine
0.501mg
0.751mg
0%
Leucine
1.068mg
1.473mg
0%
Lysine
0.376mg
0.568mg
0%
Methionine
0.428mg
0.157mg
0%
Phenylalanine
0.698mg
1.132mg
0%
Valine
0.686mg
0.855mg
0%
Histidine
0.301mg
0.539mg
0%
Fructose
0.47g
0.11g
0%
Omega-3 - ALA
0.135g
0.003g
N/A
Omega-6 - Eicosadienoic acid
0g
0.002g
N/A
Omega-6 - Linoleic acid
12.32g
N/A
Macronutrient Comparison
Macronutrient breakdown side-by-side comparison
2
13%
2%
73%
9%
2%
Protein:
13.3 g
Fats:
2.38 g
Carbs:
73.13 g
Water:
8.82 g
Other:
2.37 g
3
21%
50%
22%
4%
3%
Protein:
21.15 g
Fats:
49.93 g
Carbs:
21.55 g
Water:
4.41 g
Other:
2.96 g
Contains
more
Carbs Carbs
+239.4%
Contains
more
Water Water
+100%
Contains
more
Protein Protein
+59%
Contains
more
Fats Fats
+1997.9%
Contains
more
Other Other
+24.9%
Fat Type Comparison
Fat type breakdown side-by-side comparison
1
21%
28%
51%
Saturated fat:
Sat. Fat
0.449 g
Monounsaturated fat:
Mono. Fat
0.589 g
Polyunsaturated fat:
Poly. Fat
1.071 g
2
8%
66%
26%
Saturated fat:
Sat. Fat
3.802 g
Monounsaturated fat:
Mono. Fat
31.551 g
Polyunsaturated fat:
Poly. Fat
12.329 g
Contains
less
Sat. Fat Saturated fat
-88.2%
Contains
more
Mono. Fat Monounsaturated fat
+5256.7%
Contains
more
Poly. Fat Polyunsaturated fat
+1051.2%
Carbohydrate type comparison
Carbohydrate type breakdown side-by-side comparison
3
95%
2%
Starch:
36.56 g
Sucrose:
0.62 g
Glucose:
0.73 g
Fructose:
0.47 g
Lactose:
0 g
Maltose:
0.01 g
Galactose:
0 g
3
14%
78%
3%
2%
Starch:
0.72 g
Sucrose:
3.95 g
Glucose:
0.17 g
Fructose:
0.11 g
Lactose:
0 g
Maltose:
0.04 g
Galactose:
0.07 g
Contains
more
Starch Starch
+4977.8%
Contains
more
Glucose Glucose
+329.4%
Contains
more
Fructose Fructose
+327.3%
Contains
more
Sucrose Sucrose
+537.1%
Contains
more
Maltose Maltose
+300%
Contains
more
Galactose Galactose
+∞%