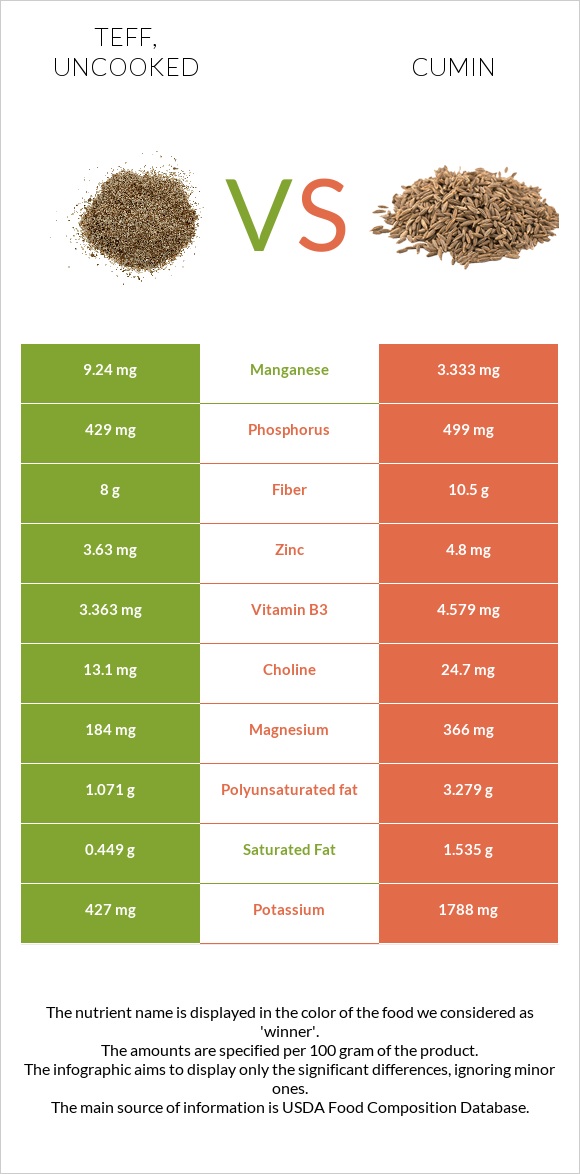
What are the main differences between teff and cumin? Teff is richer in manganese, yet cumin is richer in iron, calcium, magnesium, potassium, vitamin A, vitamin E, vitamin B1, zinc, and fiber. Cumin's daily need coverage for iron is 734% higher. Teff has 3 times more manganese than cumin. Teff has 9.24mg of manganese, while cumin has 3.333mg. We used Teff, uncooked and Spices, cumin seed types in this comparison.
Infographic
Mineral Comparison
Mineral comparison score is based on the number of minerals by which one or the other food is richer. The "coverage" charts below show how much of the daily needs can be covered by 300 grams of the food.
2
100 g
300 g
1 cup - 193g
Magnesium
Magnesium
Calcium
Calcium
Potassium
Potassium
Iron
Iron
Copper
Copper
Zinc
Zinc
Phosphorus
Phosphorus
Sodium
Sodium
Manganese
Manganese
Selenium
Selenium
131%
54%
38%
286%
270%
99%
184%
1.6%
1205%
24%
7
100 g
300 g
0.25 tsp, whole - 0.5g 1 tbsp, whole - 6g
Magnesium
Magnesium
Calcium
Calcium
Potassium
Potassium
Iron
Iron
Copper
Copper
Zinc
Zinc
Phosphorus
Phosphorus
Sodium
Sodium
Manganese
Manganese
Selenium
Selenium
261%
279%
158%
2489%
289%
131%
214%
22%
435%
28%
Vitamin Comparison
Vitamin comparison score is based on the number of vitamins by which one or the other food is richer. The "coverage" charts below show how much of the daily needs can be covered by 300 grams of the food.
1
100 g
300 g
1 cup - 193g
Vitamin C
Vit. C
Vitamin D
Vit. D
Vitamin A
Vit. A
Vitamin E
Vit. E
Vitamin B1
Vit. B1
Vitamin B2
Vit. B2
Vitamin B3
Vit. B3
Vitamin B5
Vit. B5
Vitamin B6
Vit. B6
Vitamin B12
Vit. B12
Vitamin K
Vit. K
Folate
Folate
0%
0%
0%
1.6%
98%
62%
63%
57%
111%
0%
4.8%
0%
8
100 g
300 g
0.25 tsp, whole - 0.5g 1 tbsp, whole - 6g
Vitamin C
Vit. C
Vitamin D
Vit. D
Vitamin A
Vit. A
Vitamin E
Vit. E
Vitamin B1
Vit. B1
Vitamin B2
Vit. B2
Vitamin B3
Vit. B3
Vitamin B5
Vit. B5
Vitamin B6
Vit. B6
Vitamin B12
Vit. B12
Vitamin K
Vit. K
Folate
Folate
26%
0%
21%
67%
157%
75%
86%
0%
100%
0%
14%
7.5%
All nutrients comparison - raw data values
Nutrient
DV% diff.
Iron
7.63mg
66.36mg
734%
Manganese
9.24mg
3.333mg
257%
Calcium
180mg
931mg
75%
Magnesium
184mg
366mg
43%
Potassium
427mg
1788mg
40%
Monounsaturated fat
0.589g
14.04g
34%
Fats
2.38g
22.27g
31%
Vitamin E
0.08mg
3.33mg
22%
Vitamin B1
0.39mg
0.628mg
20%
Vitamin B5
0.942mg
19%
Starch
36.56g
15%
Polyunsaturated fat
1.071g
3.279g
15%
Zinc
3.63mg
4.8mg
11%
Carbs
73.13g
44.24g
10%
Fiber
8g
10.5g
10%
Phosphorus
429mg
499mg
10%
Protein
13.3g
17.81g
9%
Vitamin C
7.7mg
9%
Vitamin B3
3.363mg
4.579mg
8%
Sodium
12mg
168mg
7%
Vitamin A
0µg
64µg
7%
Copper
0.81mg
0.867mg
6%
Saturated fat
0.449g
1.535g
5%
Vitamin B2
0.27mg
0.327mg
4%
Vitamin B6
0.482mg
0.435mg
4%
Vitamin K
1.9µg
5.4µg
3%
Folate
10µg
3%
Choline
13.1mg
24.7mg
2%
Selenium
4.4µg
5.2µg
1%
Fructose
0.47g
1%
Calories
367kcal
375kcal
0%
Protein per 100 calories
3.6g
4.7g
N/A
Calories per 10 g protein
276kcal
211kcal
N/A
Weight per 100 calories
27g
27g
N/A
Unsaturated / Saturated Fat ratio
3.7
11
N/A
Net carbs
65.13g
33.74g
N/A
Sugar
1.84g
2.25g
N/A
Tryptophan
0.139mg
0%
Threonine
0.51mg
0%
Isoleucine
0.501mg
0%
Leucine
1.068mg
0%
Lysine
0.376mg
0%
Methionine
0.428mg
0%
Phenylalanine
0.698mg
0%
Valine
0.686mg
0%
Histidine
0.301mg
0%
Omega-3 - ALA
0.135g
N/A
Macronutrient Comparison
Macronutrient breakdown side-by-side comparison
2
13%
2%
73%
9%
2%
Protein:
13.3 g
Fats:
2.38 g
Carbs:
73.13 g
Water:
8.82 g
Other:
2.37 g
3
18%
22%
44%
8%
8%
Protein:
17.81 g
Fats:
22.27 g
Carbs:
44.24 g
Water:
8.06 g
Other:
7.62 g
Contains
more
Carbs Carbs
+65.3%
Contains
more
Protein Protein
+33.9%
Contains
more
Fats Fats
+835.7%
Contains
more
Other Other
+221.5%
Fat Type Comparison
Fat type breakdown side-by-side comparison
1
21%
28%
51%
Saturated fat:
Sat. Fat
0.449 g
Monounsaturated fat:
Mono. Fat
0.589 g
Polyunsaturated fat:
Poly. Fat
1.071 g
2
8%
74%
17%
Saturated fat:
Sat. Fat
1.535 g
Monounsaturated fat:
Mono. Fat
14.04 g
Polyunsaturated fat:
Poly. Fat
3.279 g
Contains
less
Sat. Fat Saturated fat
-70.7%
Contains
more
Mono. Fat Monounsaturated fat
+2283.7%
Contains
more
Poly. Fat Polyunsaturated fat
+206.2%