Tikka Masala vs. Submarine sandwich — In-Depth Nutrition Comparison
Compare
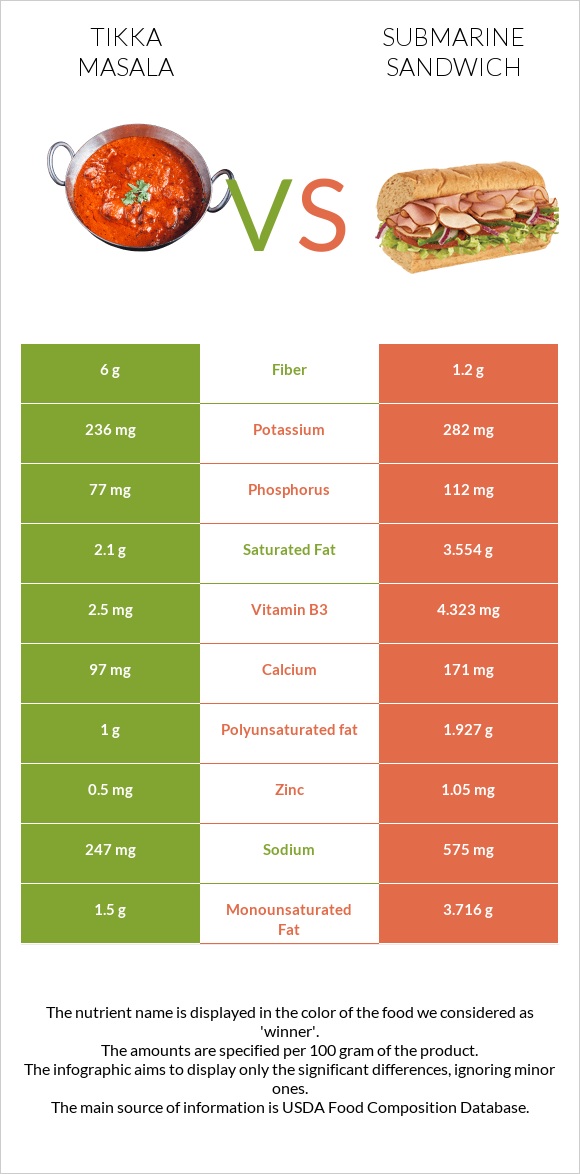
How are tikka Masala and submarine sandwich different?
- Tikka Masala is richer in fiber, while submarine sandwich is higher in vitamin B2, vitamin B6, vitamin B1, vitamin B3, folate, vitamin C, and calcium.
- Tikka Masala covers your daily need for fiber, 19% more than submarine sandwich.
KASHI Pizza, Tikka Masala, single serve, frozen, unprepared and Fast foods, submarine sandwich, cold cut on white bread with lettuce and tomato types were used in this article.
Infographic
Infographic link
Mineral Comparison
Mineral comparison score is based on the number of minerals by which one or the other food is richer. The "coverage" charts below show how much of the daily needs can be covered by 300 grams of the food.
| Contains less SodiumSodium | -57% |
| Contains more CalciumCalcium | +76.3% |
| Contains more PotassiumPotassium | +19.5% |
| Contains more IronIron | +29.3% |
| Contains more ZincZinc | +110% |
| Contains more PhosphorusPhosphorus | +45.5% |
Vitamin Comparison
Vitamin comparison score is based on the number of vitamins by which one or the other food is richer. The "coverage" charts below show how much of the daily needs can be covered by 300 grams of the food.
| Contains more Vitamin CVitamin C | +∞% |
| Contains more Vitamin B1Vitamin B1 | +71.5% |
| Contains more Vitamin B2Vitamin B2 | +167% |
| Contains more Vitamin B3Vitamin B3 | +72.9% |
| Contains more Vitamin B6Vitamin B6 | +407.5% |
| Contains more FolateFolate | +164% |
All nutrients comparison - raw data values
| Nutrient |  |
 |
DV% diff. |
| Selenium | 19.9µg | 36% | |
| Fiber | 6g | 1.2g | 19% |
| Manganese | 0.354mg | 15% | |
| Sodium | 247mg | 575mg | 14% |
| Vitamin B2 | 0.1mg | 0.267mg | 13% |
| Vitamin B6 | 0.04mg | 0.203mg | 13% |
| Vitamin B1 | 0.2mg | 0.343mg | 12% |
| Vitamin B3 | 2.5mg | 4.323mg | 11% |
| Vitamin B5 | 0.555mg | 11% | |
| Folate | 25µg | 66µg | 10% |
| Copper | 0.084mg | 9% | |
| Vitamin C | 0mg | 7.5mg | 8% |
| Calcium | 97mg | 171mg | 7% |
| Saturated fat | 2.1g | 3.554g | 7% |
| Fats | 5.9g | 10.04g | 6% |
| Cholesterol | 8mg | 27mg | 6% |
| Starch | 15.67g | 6% | |
| Monounsaturated fat | 1.5g | 3.716g | 6% |
| Polyunsaturated fat | 1g | 1.927g | 6% |
| Magnesium | 20mg | 5% | |
| Iron | 1.4mg | 1.81mg | 5% |
| Zinc | 0.5mg | 1.05mg | 5% |
| Phosphorus | 77mg | 112mg | 5% |
| Choline | 29.1mg | 5% | |
| Vitamin K | 4.5µg | 4% | |
| Carbs | 29.5g | 20.43g | 3% |
| Vitamin E | 0.41mg | 3% | |
| Vitamin A | 22µg | 2% | |
| Fructose | 1.4g | 2% | |
| Calories | 191kcal | 213kcal | 1% |
| Protein | 10.2g | 10.52g | 1% |
| Vitamin D* | 0 IU | 7 IU | 1% |
| Vitamin D | 0.2µg | 1% | |
| Potassium | 236mg | 282mg | 1% |
| Vitamin B12 | 0.2µg | 0.22µg | 1% |
| Protein per 100 calories | 5.3g | 4.9g | N/A |
| Calories per 10 g protein | 187kcal | 202kcal | N/A |
| Weight per 100 calories | 52g | 47g | N/A |
| Unsaturated / Saturated Fat ratio | 1.2 | 1.6 | N/A |
| Net carbs | 23.5g | 19.23g | N/A |
| Sugar | 4g | 3.18g | N/A |
| Trans fat | 0g | 0.119g | N/A |
| Tryptophan | 0.1mg | 0% | |
| Threonine | 0.331mg | 0% | |
| Isoleucine | 0.431mg | 0% | |
| Leucine | 0.752mg | 0% | |
| Lysine | 0.491mg | 0% | |
| Methionine | 0.21mg | 0% | |
| Phenylalanine | 0.431mg | 0% | |
| Valine | 0.501mg | 0% | |
| Histidine | 0.301mg | 0% | |
| Omega-3 - EPA | 0.001g | N/A | |
| Omega-3 - DHA | 0.002g | N/A | |
| Omega-3 - ALA | 0.104g | N/A | |
| Omega-3 - DPA | 0.005g | N/A | |
| Omega-3 - Eicosatrienoic acid | 0.004g | N/A | |
| Omega-6 - Gamma-linoleic acid | 0.003g | N/A | |
| Omega-6 - Dihomo-gamma-linoleic acid | 0.013g | N/A | |
| Omega-6 - Eicosadienoic acid | 0.048g | N/A | |
| Omega-6 - Linoleic acid | 1.665g | N/A |
Macronutrient Comparison
Macronutrient breakdown side-by-side comparison
Protein:
10.2 g
Fats:
5.9 g
Carbs:
29.5 g
Water:
49 g
Other:
5.4 g
Protein:
10.52 g
Fats:
10.04 g
Carbs:
20.43 g
Water:
56.51 g
Other:
2.5 g
| Contains more CarbsCarbs | +44.4% |
| Contains more OtherOther | +116% |
| Contains more FatsFats | +70.2% |
| Contains more WaterWater | +15.3% |
~equal in
Protein
~10.52g
Fat Type Comparison
Fat type breakdown side-by-side comparison
Saturated fat:
Sat. Fat
2.1 g
Monounsaturated fat:
Mono. Fat
1.5 g
Polyunsaturated fat:
Poly. Fat
1 g
Saturated fat:
Sat. Fat
3.554 g
Monounsaturated fat:
Mono. Fat
3.716 g
Polyunsaturated fat:
Poly. Fat
1.927 g
| Contains less Sat. FatSaturated fat | -40.9% |
| Contains more Mono. FatMonounsaturated fat | +147.7% |
| Contains more Poly. FatPolyunsaturated fat | +92.7% |


