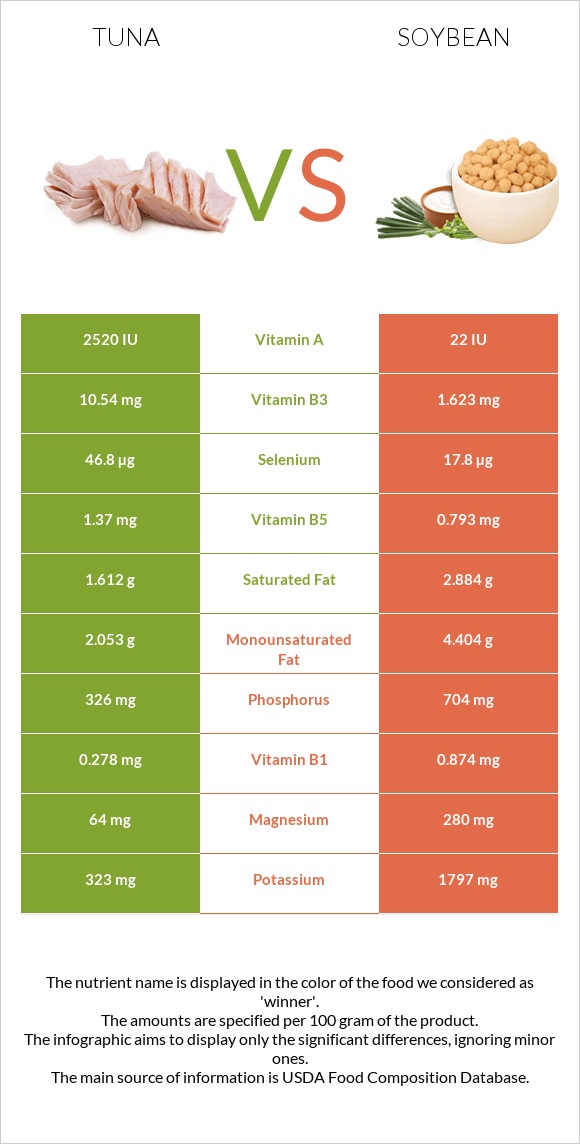
Significant differences between tuna and soybeans Tuna has more selenium, vitamin B3, vitamin B12, and vitamin B6; however, soybeans are richer in iron, copper, manganese, fiber, and vitamin K. Tuna covers your daily selenium needs 183% more than soybeans. Soybeans contain less cholesterol. Soybeans have a higher glycemic index. The glycemic index of soybeans is 14, while the glycemic index of tuna is 0. Specific food types used in this comparison are Fish, tuna, yellowfin, fresh, cooked, dry heat and Soybeans, mature cooked, boiled, without salt .
Infographic
Mineral Comparison
Mineral comparison score is based on the number of minerals by which one or the other food is richer. The "coverage" charts below show how much of the daily needs can be covered by 300 grams of the food.
2
100 g
300 g
3 oz - 85g
Magnesium
Magnesium
Calcium
Calcium
Potassium
Potassium
Iron
Iron
Copper
Copper
Zinc
Zinc
Phosphorus
Phosphorus
Sodium
Sodium
Manganese
Manganese
Selenium
Selenium
30%
1.2%
47%
35%
14%
12%
143%
7%
1.7%
590%
7
100 g
300 g
1 tbsp - 10.7g 1 cup - 172g
Magnesium
Magnesium
Calcium
Calcium
Potassium
Potassium
Iron
Iron
Copper
Copper
Zinc
Zinc
Phosphorus
Phosphorus
Sodium
Sodium
Manganese
Manganese
Selenium
Selenium
61%
31%
45%
193%
136%
31%
105%
0.13%
107%
40%
Vitamin Comparison
Vitamin comparison score is based on the number of vitamins by which one or the other food is richer. The "coverage" charts below show how much of the daily needs can be covered by 300 grams of the food.
6
100 g
300 g
3 oz - 85g
Vitamin C
Vit. C
Vitamin D
Vit. D
Vitamin A
Vit. A
Vitamin E
Vit. E
Vitamin B1
Vit. B1
Vitamin B2
Vit. B2
Vitamin B3
Vit. B3
Vitamin B5
Vit. B5
Vitamin B6
Vit. B6
Vitamin B12
Vit. B12
Vitamin K
Vit. K
Folate
Folate
0%
30%
7.3%
5.8%
34%
32%
414%
20%
240%
294%
0.25%
1.5%
6
100 g
300 g
1 tbsp - 10.7g 1 cup - 172g
Vitamin C
Vit. C
Vitamin D
Vit. D
Vitamin A
Vit. A
Vitamin E
Vit. E
Vitamin B1
Vit. B1
Vitamin B2
Vit. B2
Vitamin B3
Vit. B3
Vitamin B5
Vit. B5
Vitamin B6
Vit. B6
Vitamin B12
Vit. B12
Vitamin K
Vit. K
Folate
Folate
5.7%
0%
0%
7%
39%
66%
7.5%
11%
54%
0%
48%
41%
All nutrients comparison - raw data values
Nutrient
DV% diff.
Selenium
108.2µg
7.3µg
183%
Vitamin B3
22.07mg
0.399mg
135%
Vitamin B12
2.35µg
0µg
98%
Vitamin B6
1.038mg
0.234mg
62%
Iron
0.92mg
5.14mg
53%
Copper
0.043mg
0.407mg
40%
Manganese
0.013mg
0.824mg
35%
Polyunsaturated fat
0.175g
5.064g
33%
Fiber
0g
6g
24%
Protein
29.15g
18.21g
22%
Cholesterol
47mg
0mg
16%
Vitamin K
0.1µg
19.2µg
16%
Fats
0.59g
8.97g
13%
Phosphorus
333mg
245mg
13%
Folate
2µg
54µg
13%
Vitamin B2
0.137mg
0.285mg
11%
Vitamin D*
82 IU
0 IU
10%
Vitamin D
2µg
0µg
10%
Magnesium
42mg
86mg
10%
Calcium
4mg
102mg
10%
Zinc
0.45mg
1.15mg
6%
Choline
77.6mg
47.5mg
5%
Saturated fat
0.205g
1.297g
5%
Monounsaturated fat
0.138g
1.981g
5%
Carbs
0g
8.36g
3%
Vitamin B5
0.334mg
0.179mg
3%
Calories
130kcal
172kcal
2%
Vitamin C
0mg
1.7mg
2%
Sodium
54mg
1mg
2%
Vitamin A
22µg
0µg
2%
Vitamin B1
0.134mg
0.155mg
2%
Protein per 100 calories
22g
11g
N/A
Calories per 10 g protein
45kcal
94kcal
N/A
Weight per 100 calories
77g
58g
N/A
Unsaturated / Saturated Fat ratio
1.5
5.4
N/A
Net carbs
0g
2.36g
N/A
Potassium
527mg
515mg
0%
Sugar
0g
3g
N/A
Vitamin E
0.29mg
0.35mg
0%
Trans fat
0.02g
0g
N/A
Tryptophan
0.313mg
0.242mg
0%
Threonine
1.224mg
0.723mg
0%
Isoleucine
1.287mg
0.807mg
0%
Leucine
2.27mg
1.355mg
0%
Lysine
2.565mg
1.108mg
0%
Methionine
0.827mg
0.224mg
0%
Phenylalanine
1.091mg
0.869mg
0%
Valine
1.438mg
0.831mg
0%
Histidine
0.822mg
0.449mg
0%
Omega-3 - EPA
0.015g
0g
N/A
Omega-3 - DHA
0.105g
0g
N/A
Omega-3 - DPA
0.005g
0g
N/A
Omega-6 - Eicosadienoic acid
0.002g
N/A
Macronutrient Comparison
Macronutrient breakdown side-by-side comparison
2
29%
69%
Protein:
29.15 g
Fats:
0.59 g
Carbs:
0 g
Water:
68.98 g
Other:
1.28 g
3
18%
9%
8%
63%
2%
Protein:
18.21 g
Fats:
8.97 g
Carbs:
8.36 g
Water:
62.55 g
Other:
1.91 g
Contains
more
Protein Protein
+60.1%
Contains
more
Fats Fats
+1420.3%
Contains
more
Carbs Carbs
+∞%
Contains
more
Other Other
+49.2%
Fat Type Comparison
Fat type breakdown side-by-side comparison
1
40%
27%
34%
Saturated fat:
Sat. Fat
0.205 g
Monounsaturated fat:
Mono. Fat
0.138 g
Polyunsaturated fat:
Poly. Fat
0.175 g
2
16%
24%
61%
Saturated fat:
Sat. Fat
1.297 g
Monounsaturated fat:
Mono. Fat
1.981 g
Polyunsaturated fat:
Poly. Fat
5.064 g
Contains
less
Sat. Fat Saturated fat
-84.2%
Contains
more
Mono. Fat Monounsaturated fat
+1335.5%
Contains
more
Poly. Fat Polyunsaturated fat
+2793.7%