What's the difference between collard greens and mustard greens?


Summary
In short, collard greens are denser in nutrients, providing nearly two times more calories, carbohydrates, and protein. However, while collard greens are three times richer in dietary fiber, the two leafy greens contain nearly the same amount of net carbs.
Collard greens are a better source of vitamins, being four times richer in vitamin B1, three times richer in vitamin B6, and overall richer in vitamins A, C, K, B2, and B3. Collard also contains more manganese, phosphorus, and calcium.
Nevertheless, turnip greens are six times richer in folate or vitamin B9, two times richer in vitamin E, and have higher levels of copper, iron, selenium, and potassium.
Introduction
Turnip and collard greens are both leafy green vegetables commonly used in Southern US cuisine. In this article, we will discuss the main differences and similarities between these two greens, focusing on health and nutrition.
Appearance, Taste, and Use
Turnip greens have smaller leaves that are typically a bright green color and have a slightly ruffled texture. The stems are edible but can be tough, so they are often removed before cooking.
Collards, on the other hand, have larger, thicker leaves that are bluish-green in color and smoother in texture. The stems of collard greens are also usually removed before cooking, as they can be very tough and fibrous.
Turnip greens have a slightly bitter taste and a peppery flavor, while collard greens have a milder, slightly sweet taste.
Turnip greens have a more tender texture than collard greens, which can be tougher and chewier.
Turnip greens are often used in stews and soups, as well as sautéed as a side dish. Collard greens are more commonly used in dishes such as salads, collard greens, and ham hocks or as a side dish in boiled or steamed form.
Nutrition
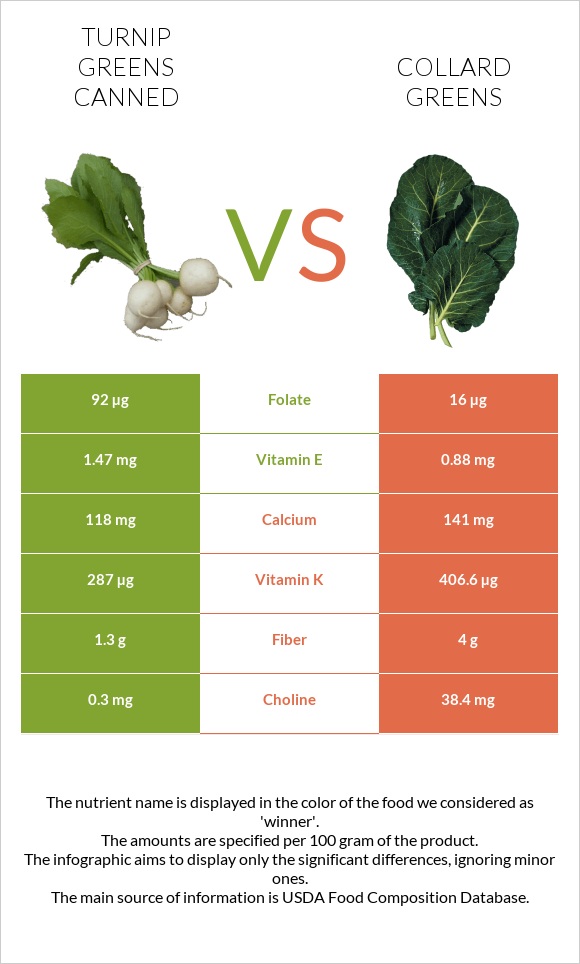
The nutritional infographics below are presented for 100g servings of canned turnip greens with no added salt and boiled collard, drained and without salt.
The average serving size per person is one cup of chopped leafy greens, which equals around 144g for turnip greens and 190g for collards.
Macronutrients and Calories
Like most vegetables, collard and turnip greens are not very dense in nutrients, as they contain a lot of water. Collard greens are a little denser, consisting of 90% water and 10% nutrients, while turnip greens are made up of 95% water and 5% nutrients.
The primary macronutrients found in these vegetables are carbs, followed by protein, containing very little fat.
Macronutrient Comparison
Contains
more
OtherOther
+13.5%
Contains
more
ProteinProtein
+99.3%
Contains
more
FatsFats
+140%
Contains
more
CarbsCarbs
+101.1%
Calories
Collard and turnip greens are both very low in calories. However, collards provide almost double the calories, containing 33 calories per 100g compared to the 19 calories in a 100g serving of turnip greens.
Carbohydrates
Collard greens contain almost twice the number of carbohydrates compared to turnip greens. That being said, this is primarily due to dietary fiber, as the two contain nearly the same amount of net carbs.
A 100g serving of collard provides 5.65g of carbs, whereas the same serving of turnip greens contains 2.81g.
Collards are over three times richer in dietary fiber compared to turnip greens. At the same time, both leafy vegetables contain around 1.5g of net carbs. Collard greens are only slightly higher in net carbs.
Collard greens are an excellent source of dietary fiber, falling in the top 21% of foods as a source of this nutrient.
Protein
Collards are again about two times richer in protein, containing 2.7g per 100g serving. Turnip greens contain 1.36g of protein in the same serving size.
Overall, leafy greens are not the best source of protein.
Fats
Turnip and collard greens contain less the 1g of fats per 100g serving. While collards contain double the amount of fats as turnip greens, this number is still insignificant.
Vitamins
Collard greens are the absolute winner in this category. They provide four times more vitamin B1, three times more vitamin B6, and overall more vitamins A, C, and K, and vitamins B2 and B3.
At the same time, turnip greens are about six times richer in folate or vitamin B9 and nearly two times richer in vitamin E.
Vitamin Comparison
Contains
more
Vitamin EVitamin E
+67%
Contains
more
FolateFolate
+475%
Contains
more
Vitamin CVitamin C
+17.4%
Contains
more
Vitamin AVitamin A
+27.5%
Contains
more
Vitamin B1Vitamin B1
+300%
Contains
more
Vitamin B2Vitamin B2
+76.7%
Contains
more
Vitamin B3Vitamin B3
+59.7%
Contains
more
Vitamin B6Vitamin B6
+220%
Contains
more
Vitamin KVitamin K
+41.7%
Minerals
Turnip greens are a better source of copper, iron, selenium, and potassium. On the other hand, collards provide higher levels of manganese, phosphorus, and calcium.
Unsalted collards are lower in sodium than unsalted turnip greens.
Mineral Comparison
Contains
more
PotassiumPotassium
+20.5%
Contains
more
IronIron
+33.6%
Contains
more
CopperCopper
+62.7%
Contains
more
SeleniumSelenium
+40%
Contains
more
CalciumCalcium
+19.5%
Contains
more
PhosphorusPhosphorus
+52.4%
Contains
less
SodiumSodium
-48.3%
Contains
more
ManganeseManganese
+93.9%
Health Impact
Leafy greens are widely known for their beneficial health effects. In this section, we will look at the scientific evidence behind these claims.
Cardiovascular Health
Intake of leafy green vegetables, including turnip and collard greens, was associated with a lower incidence of cardiovascular disease and may be a promising first-line prevention method (1).
Specific research on turnip greens in people is still limited. However, new in vitro and in vivo research points to the importance of turnips in promoting health, thanks to their anti-inflammatory and antioxidant characteristics (2).
Research has also shown that regular consumption of steam-cooked collard greens can reduce the risk of cardiovascular disease (3).
Diabetes
While there is no research on the specific numbers for glycemic index values for turnip and collard greens, these values can be assumed to be low due to their high dietary fiber and low net carb content.
Turnip leaf aqueous extract has been discovered to lower blood glucose levels in diabetic rats (4).
Research has demonstrated that collard greens have a protective effect against diabetes and can be included in a diabetic patient's diet program (5).
Digestive System
Green leafy vegetables, such as collard and turnip greens, can be an excellent source of dietary fiber. Collard greens fall in the top 21% of foods as a source of dietary fiber, while turnip greens fall in the top 46%.
Research has found that increased vegetable fiber intake results in a healthier digestive system, a healthy body weight, a lower risk of cardiovascular diseases, and perhaps even a lower chance of colon cancer. It also had a role in addressing the issues of obesity, diverticulitis, diabetes, and constipation (6).
By lowering the reabsorption of cholesterol produced by the body to aid in fat breakdown, fiber has been reported to lower cholesterol levels (6).
Sources.
- https://www.ncbi.nlm.nih.gov/pmc/articles/PMC8756059/
- https://www.ncbi.nlm.nih.gov/pmc/articles/PMC7888597/
- https://www.ncbi.nlm.nih.gov/pmc/articles/PMC4973479/
- https://www.ncbi.nlm.nih.gov/pmc/articles/PMC4418064/
- https://pubmed.ncbi.nlm.nih.gov/32990547/
- https://www.phytojournal.com/archives/2020/vol9issue5/PartAI/9-5-258-155.pdf

Infographic
All nutrients comparison - raw data values
| Nutrient | |
|
DV% diff. |
| Vitamin K | 287µg | 406.6µg | 100% |
| Folate | 92µg | 16µg | 19% |
| Fiber | 1.3g | 4g | 11% |
| Manganese | 0.263mg | 0.51mg | 11% |
| Vitamin A | 298µg | 380µg | 9% |
| Vitamin B6 | 0.04mg | 0.128mg | 7% |
| Choline | 0.3mg | 38.4mg | 7% |
| Iron | 1.51mg | 1.13mg | 5% |
| Copper | 0.083mg | 0.051mg | 4% |
| Vitamin E | 1.47mg | 0.88mg | 4% |
| Vitamin B2 | 0.06mg | 0.106mg | 4% |
| Protein | 1.36g | 2.71g | 3% |
| Vitamin C | 15.5mg | 18.2mg | 3% |
| Vitamin B1 | 0.01mg | 0.04mg | 3% |
| Calcium | 118mg | 141mg | 2% |
| Phosphorus | 21mg | 32mg | 2% |
| Calories | 19kcal | 33kcal | 1% |
| Fats | 0.3g | 0.72g | 1% |
| Carbs | 2.81g | 5.65g | 1% |
| Potassium | 141mg | 117mg | 1% |
| Sodium | 29mg | 15mg | 1% |
| Vitamin B3 | 0.36mg | 0.575mg | 1% |
| Protein per 100 calories | 7.2g | 8.2g | N/A |
| Calories per 10 g protein | 140kcal | 122kcal | N/A |
| Weight per 100 calories | 526g | 303g | N/A |
| Net carbs | 1.51g | 1.65g | N/A |
| Magnesium | 20mg | 21mg | 0% |
| Sugar | 0.42g | 0.4g | N/A |
| Zinc | 0.23mg | 0.23mg | 0% |
| Selenium | 0.7µg | 0.5µg | 0% |
| Vitamin B5 | 0.214mg | 0.218mg | 0% |
| Saturated fat | 0.07g | 0.047g | 0% |
| Monounsaturated fat | 0.02g | 0.026g | 0% |
| Polyunsaturated fat | 0.12g | 0.173g | 0% |
| Tryptophan | 0.027mg | 0% | |
| Threonine | 0.074mg | 0% | |
| Isoleucine | 0.086mg | 0% | |
| Leucine | 0.13mg | 0% | |
| Lysine | 0.101mg | 0% | |
| Methionine | 0.028mg | 0% | |
| Phenylalanine | 0.075mg | 0% | |
| Valine | 0.104mg | 0% | |
| Histidine | 0.04mg | 0% |
Fat Type Comparison
| Contains less Sat. FatSaturated fat | -32.9% |
| Contains more Mono. FatMonounsaturated fat | +30% |
| Contains more Poly. FatPolyunsaturated fat | +44.2% |
References
All the values for which the sources are not specified explicitly are taken from FDA’s Food Central. The exact link to the food presented on this page can be found below.
- Turnip greens canned - https://fdc.nal.usda.gov/fdc-app.html#/food-details/168119/nutrients
- Collard Greens - https://fdc.nal.usda.gov/fdc-app.html#/food-details/170407/nutrients
All the Daily Values are presented for males aged 31-50, for 2000-calorie diets.