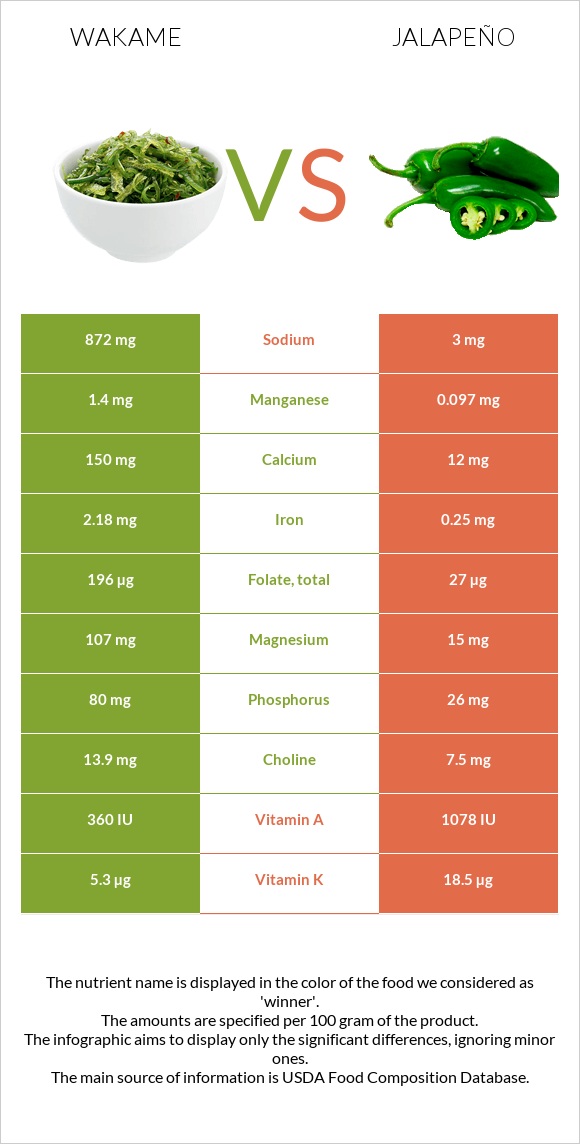
How are wakame and jalapeño different? Wakame has more manganese, folate, copper, iron, and magnesium; however, jalapeño is richer in vitamin C, vitamin B6, vitamin E, and vitamin A. Jalapeño covers your daily need for vitamin C, 128% more than wakame. Wakame has 291 times more sodium than jalapeño. Wakame has 872mg of sodium, while jalapeño has 3mg. Seaweed, wakame, raw and Peppers, jalapeno, raw types were used in this article.
Infographic
Mineral Comparison
Mineral comparison score is based on the number of minerals by which one or the other food is richer. The "coverage" charts below show how much of the daily needs can be covered by 300 grams of the food.
8
100 g
300 g
2 tbsp (1/8 cup) - 10g
Magnesium
Magnesium
Calcium
Calcium
Potassium
Potassium
Iron
Iron
Copper
Copper
Zinc
Zinc
Phosphorus
Phosphorus
Sodium
Sodium
Manganese
Manganese
Selenium
Selenium
76%
45%
4.4%
82%
95%
10%
34%
114%
183%
3.8%
2
100 g
300 g
1 pepper - 14g 1 cup, sliced - 90g
Magnesium
Magnesium
Calcium
Calcium
Potassium
Potassium
Iron
Iron
Copper
Copper
Zinc
Zinc
Phosphorus
Phosphorus
Sodium
Sodium
Manganese
Manganese
Selenium
Selenium
11%
3.6%
22%
9.4%
15%
3.8%
11%
0.39%
13%
2.2%
Vitamin Comparison
Vitamin comparison score is based on the number of vitamins by which one or the other food is richer. The "coverage" charts below show how much of the daily needs can be covered by 300 grams of the food.
5
100 g
300 g
2 tbsp (1/8 cup) - 10g
Vitamin C
Vit. C
Vitamin D
Vit. D
Vitamin A
Vit. A
Vitamin E
Vit. E
Vitamin B1
Vit. B1
Vitamin B2
Vit. B2
Vitamin B3
Vit. B3
Vitamin B5
Vit. B5
Vitamin B6
Vit. B6
Vitamin B12
Vit. B12
Vitamin K
Vit. K
Folate
Folate
10%
0%
6%
20%
15%
53%
30%
42%
0.46%
0%
13%
147%
5
100 g
300 g
1 pepper - 14g 1 cup, sliced - 90g
Vitamin C
Vit. C
Vitamin D
Vit. D
Vitamin A
Vit. A
Vitamin E
Vit. E
Vitamin B1
Vit. B1
Vitamin B2
Vit. B2
Vitamin B3
Vit. B3
Vitamin B5
Vit. B5
Vitamin B6
Vit. B6
Vitamin B12
Vit. B12
Vitamin K
Vit. K
Folate
Folate
395%
0%
18%
72%
10%
16%
24%
19%
97%
0%
46%
20%
All nutrients comparison - raw data values
Nutrient
DV% diff.
Vitamin C
3mg
118.6mg
128%
Manganese
1.4mg
0.097mg
57%
Folate
196µg
27µg
42%
Sodium
872mg
3mg
38%
Vitamin B6
0.002mg
0.419mg
32%
Copper
0.284mg
0.046mg
26%
Iron
2.18mg
0.25mg
24%
Magnesium
107mg
15mg
22%
Vitamin E
1mg
3.58mg
17%
Calcium
150mg
12mg
14%
Vitamin B2
0.23mg
0.07mg
12%
Vitamin K
5.3µg
18.5µg
11%
Fiber
0.5g
2.8g
9%
Phosphorus
80mg
26mg
8%
Vitamin B5
0.697mg
0.315mg
8%
Potassium
50mg
248mg
6%
Protein
3.03g
0.91g
4%
Vitamin A
18µg
54µg
4%
Fructose
2.63g
3%
Zinc
0.38mg
0.14mg
2%
Vitamin B1
0.06mg
0.04mg
2%
Vitamin B3
1.6mg
1.28mg
2%
Calories
45kcal
29kcal
1%
Carbs
9.14g
6.5g
1%
Selenium
0.7µg
0.4µg
1%
Choline
13.9mg
7.5mg
1%
Polyunsaturated fat
0.218g
0.112g
1%
Protein per 100 calories
6.7g
3.1g
N/A
Calories per 10 g protein
149kcal
319kcal
N/A
Weight per 100 calories
222g
345g
N/A
Fats
0.64g
0.37g
0%
Net carbs
8.64g
3.7g
N/A
Sugar
0.65g
4.12g
N/A
Saturated fat
0.13g
0.092g
0%
Monounsaturated fat
0.058g
0.029g
0%
Tryptophan
0.035mg
0%
Threonine
0.165mg
0%
Isoleucine
0.087mg
0%
Leucine
0.257mg
0%
Lysine
0.112mg
0%
Methionine
0.063mg
0%
Phenylalanine
0.112mg
0%
Valine
0.209mg
0%
Histidine
0.015mg
0%
Omega-3 - EPA
0.186g
0g
N/A
Omega-3 - ALA
0.05g
N/A
Omega-6 - Linoleic acid
0.062g
N/A
Macronutrient Comparison
Macronutrient breakdown side-by-side comparison
4
3%
9%
80%
7%
Protein:
3.03 g
Fats:
0.64 g
Carbs:
9.14 g
Water:
79.99 g
Other:
7.2 g
1
7%
92%
Protein:
0.91 g
Fats:
0.37 g
Carbs:
6.5 g
Water:
91.69 g
Other:
0.53 g
Contains
more
Protein Protein
+233%
Contains
more
Fats Fats
+73%
Contains
more
Carbs Carbs
+40.6%
Contains
more
Other Other
+1258.5%
Contains
more
Water Water
+14.6%
Fat Type Comparison
Fat type breakdown side-by-side comparison
2
32%
14%
54%
Saturated fat:
Sat. Fat
0.13 g
Monounsaturated fat:
Mono. Fat
0.058 g
Polyunsaturated fat:
Poly. Fat
0.218 g
1
39%
12%
48%
Saturated fat:
Sat. Fat
0.092 g
Monounsaturated fat:
Mono. Fat
0.029 g
Polyunsaturated fat:
Poly. Fat
0.112 g
Contains
more
Mono. Fat Monounsaturated fat
+100%
Contains
more
Poly. Fat Polyunsaturated fat
+94.6%
Contains
less
Sat. Fat Saturated fat
-29.2%