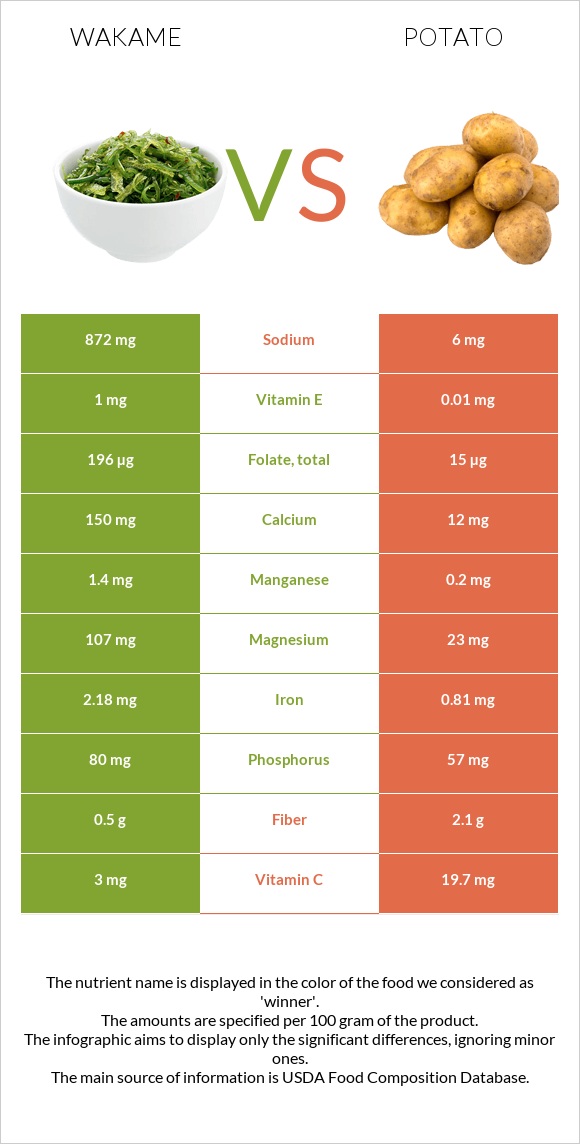
Summary of differences between wakame and potatoes Wakame has more manganese, folate, magnesium, copper, vitamin B2, iron, and calcium; however, potatoes are higher in vitamin B6 and potassium. Wakame covers your daily need for manganese, 51% more than potatoes. Wakame has 87 times more sodium than potatoes. While wakame has 872mg of sodium, potatoes have only 10mg. These are the specific foods used in this comparison Seaweed, wakame, raw and Potatoes, baked, flesh, and skin, without salt .
Infographic
Mineral Comparison
Mineral comparison score is based on the number of minerals by which one or the other food is richer. The "coverage" charts below show how much of the daily needs can be covered by 300 grams of the food.
7
100 g
300 g
2 tbsp (1/8 cup) - 10g
Magnesium
Magnesium
Calcium
Calcium
Potassium
Potassium
Iron
Iron
Copper
Copper
Zinc
Zinc
Phosphorus
Phosphorus
Sodium
Sodium
Manganese
Manganese
Selenium
Selenium
76%
45%
4.4%
82%
95%
10%
34%
114%
183%
3.8%
2
100 g
300 g
1 potato small - 138g 1 NLEA serving - 148g 1 potato medium - 173g 1 potato large - 299g
Magnesium
Magnesium
Calcium
Calcium
Potassium
Potassium
Iron
Iron
Copper
Copper
Zinc
Zinc
Phosphorus
Phosphorus
Sodium
Sodium
Manganese
Manganese
Selenium
Selenium
20%
4.5%
47%
41%
39%
9.8%
30%
1.3%
29%
2.2%
Vitamin Comparison
Vitamin comparison score is based on the number of vitamins by which one or the other food is richer. The "coverage" charts below show how much of the daily needs can be covered by 300 grams of the food.
7
100 g
300 g
2 tbsp (1/8 cup) - 10g
Vitamin C
Vit. C
Vitamin D
Vit. D
Vitamin A
Vit. A
Vitamin E
Vit. E
Vitamin B1
Vit. B1
Vitamin B2
Vit. B2
Vitamin B3
Vit. B3
Vitamin B5
Vit. B5
Vitamin B6
Vit. B6
Vitamin B12
Vit. B12
Vitamin K
Vit. K
Folate
Folate
10%
0%
6%
20%
15%
53%
30%
42%
0.46%
0%
13%
147%
2
100 g
300 g
1 potato small - 138g 1 NLEA serving - 148g 1 potato medium - 173g 1 potato large - 299g
Vitamin C
Vit. C
Vitamin D
Vit. D
Vitamin A
Vit. A
Vitamin E
Vit. E
Vitamin B1
Vit. B1
Vitamin B2
Vit. B2
Vitamin B3
Vit. B3
Vitamin B5
Vit. B5
Vitamin B6
Vit. B6
Vitamin B12
Vit. B12
Vitamin K
Vit. K
Folate
Folate
32%
0%
0.33%
0.8%
16%
11%
26%
23%
72%
0%
5%
21%
All nutrients comparison - raw data values
Nutrient
DV% diff.
Manganese
1.4mg
0.219mg
51%
Folate
196µg
28µg
42%
Sodium
872mg
10mg
37%
Vitamin B6
0.002mg
0.311mg
24%
Magnesium
107mg
28mg
19%
Copper
0.284mg
0.118mg
18%
Calcium
150mg
15mg
14%
Potassium
50mg
535mg
14%
Iron
2.18mg
1.08mg
14%
Vitamin B2
0.23mg
0.048mg
14%
Vitamin C
3mg
9.6mg
7%
Fiber
0.5g
2.2g
7%
Starch
17.27g
7%
Vitamin E
1mg
0.04mg
6%
Vitamin B5
0.697mg
0.376mg
6%
Carbs
9.14g
21.15g
4%
Vitamin K
5.3µg
2µg
3%
Calories
45kcal
93kcal
2%
Vitamin A
18µg
1µg
2%
Protein
3.03g
2.5g
1%
Fats
0.64g
0.13g
1%
Phosphorus
80mg
70mg
1%
Selenium
0.7µg
0.4µg
1%
Vitamin B3
1.6mg
1.41mg
1%
Polyunsaturated fat
0.218g
0.057g
1%
Protein per 100 calories
6.7g
2.7g
N/A
Calories per 10 g protein
149kcal
372kcal
N/A
Weight per 100 calories
222g
108g
N/A
Net carbs
8.64g
18.95g
N/A
Sugar
0.65g
1.18g
N/A
Zinc
0.38mg
0.36mg
0%
Vitamin B1
0.06mg
0.064mg
0%
Choline
13.9mg
14.8mg
0%
Saturated fat
0.13g
0.034g
0%
Monounsaturated fat
0.058g
0.003g
0%
Tryptophan
0.035mg
0.025mg
0%
Threonine
0.165mg
0.081mg
0%
Isoleucine
0.087mg
0.08mg
0%
Leucine
0.257mg
0.119mg
0%
Lysine
0.112mg
0.13mg
0%
Methionine
0.063mg
0.038mg
0%
Phenylalanine
0.112mg
0.099mg
0%
Valine
0.209mg
0.125mg
0%
Histidine
0.015mg
0.042mg
0%
Fructose
0.34g
0%
Omega-3 - EPA
0.186g
0g
N/A
Macronutrient Comparison
Macronutrient breakdown side-by-side comparison
4
3%
9%
80%
7%
Protein:
3.03 g
Fats:
0.64 g
Carbs:
9.14 g
Water:
79.99 g
Other:
7.2 g
1
3%
21%
75%
Protein:
2.5 g
Fats:
0.13 g
Carbs:
21.15 g
Water:
74.89 g
Other:
1.33 g
Contains
more
Protein Protein
+21.2%
Contains
more
Fats Fats
+392.3%
Contains
more
Other Other
+441.4%
Contains
more
Carbs Carbs
+131.4%
Fat Type Comparison
Fat type breakdown side-by-side comparison
2
32%
14%
54%
Saturated fat:
Sat. Fat
0.13 g
Monounsaturated fat:
Mono. Fat
0.058 g
Polyunsaturated fat:
Poly. Fat
0.218 g
1
36%
3%
61%
Saturated fat:
Sat. Fat
0.034 g
Monounsaturated fat:
Mono. Fat
0.003 g
Polyunsaturated fat:
Poly. Fat
0.057 g
Contains
more
Mono. Fat Monounsaturated fat
+1833.3%
Contains
more
Poly. Fat Polyunsaturated fat
+282.5%
Contains
less
Sat. Fat Saturated fat
-73.8%