Wendy's hamburger vs. Taco salad — In-Depth Nutrition Comparison
Compare
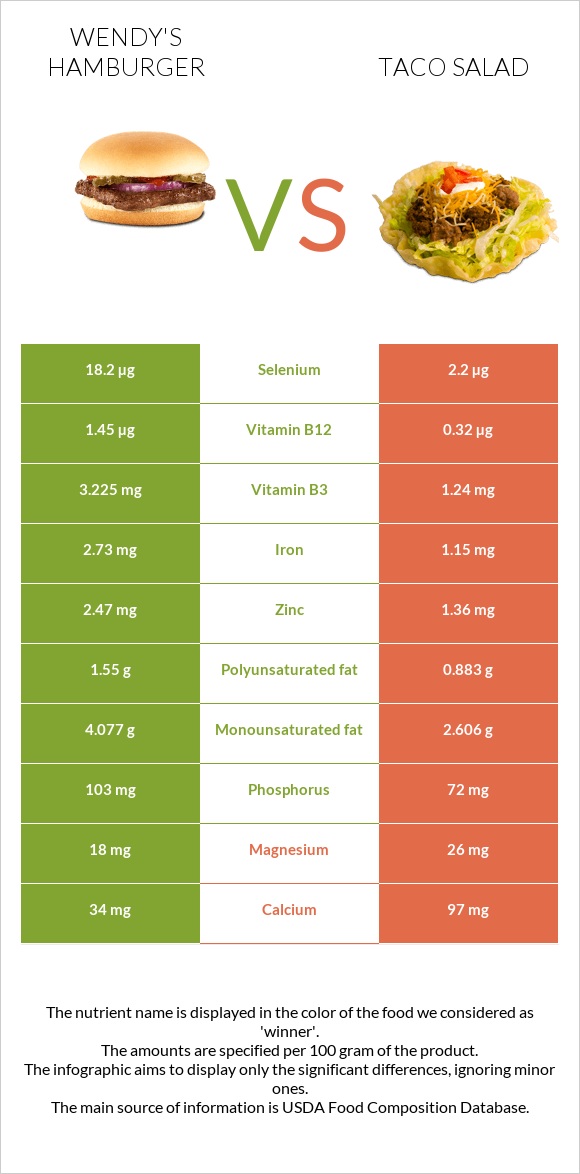
Important differences between wendy's hamburgers and taco salad
- Wendy's hamburgers have more vitamin B12, selenium, iron, vitamin B1, vitamin B3, and zinc; however, taco salad has more vitamin B5 and calcium.
- Wendy's hamburgers' daily need coverage for vitamin B12 is 47% more.
- Wendy's hamburgers have 8 times more selenium than taco salad. Wendy's hamburgers have 18.2µg of selenium, while taco salad has 2.2µg.
The food varieties used in the comparison are WENDY'S, CLASSIC SINGLE Hamburger, no cheese and Fast foods, taco salad.
Infographic
Infographic link
Mineral Comparison
Mineral comparison score is based on the number of minerals by which one or the other food is richer. The "coverage" charts below show how much of the daily needs can be covered by 300 grams of the food.
| Contains more IronIron | +137.4% |
| Contains more CopperCopper | +23% |
| Contains more ZincZinc | +81.6% |
| Contains more PhosphorusPhosphorus | +43.1% |
| Contains more ManganeseManganese | +12% |
| Contains more SeleniumSelenium | +727.3% |
| Contains more MagnesiumMagnesium | +44.4% |
| Contains more CalciumCalcium | +185.3% |
Vitamin Comparison
Vitamin comparison score is based on the number of vitamins by which one or the other food is richer. The "coverage" charts below show how much of the daily needs can be covered by 300 grams of the food.
| Contains more Vitamin B1Vitamin B1 | +450% |
| Contains more Vitamin B2Vitamin B2 | +13.9% |
| Contains more Vitamin B3Vitamin B3 | +160.1% |
| Contains more Vitamin B12Vitamin B12 | +353.1% |
| Contains more Vitamin KVitamin K | +∞% |
| Contains more Vitamin CVitamin C | +260% |
| Contains more Vitamin B5Vitamin B5 | +102.4% |
All nutrients comparison - raw data values
| Nutrient |  |
 |
DV% diff. |
| Vitamin B12 | 1.45µg | 0.32µg | 47% |
| Selenium | 18.2µg | 2.2µg | 29% |
| Iron | 2.73mg | 1.15mg | 20% |
| Vitamin B1 | 0.275mg | 0.05mg | 19% |
| Protein | 12.63g | 6.68g | 12% |
| Vitamin B3 | 3.225mg | 1.24mg | 12% |
| Folate | 42µg | 11% | |
| Zinc | 2.47mg | 1.36mg | 10% |
| Vitamin K | 9µg | 8% | |
| Vitamin B5 | 0.336mg | 0.68mg | 7% |
| Calcium | 34mg | 97mg | 6% |
| Fats | 10.6g | 7.46g | 5% |
| Fiber | 1.3g | 5% | |
| Starch | 11.52g | 5% | |
| Calories | 213kcal | 141kcal | 4% |
| Cholesterol | 35mg | 22mg | 4% |
| Phosphorus | 103mg | 72mg | 4% |
| Choline | 23.3mg | 4% | |
| Monounsaturated fat | 4.077g | 2.606g | 4% |
| Polyunsaturated fat | 1.55g | 0.883g | 4% |
| Copper | 0.139mg | 0.113mg | 3% |
| Carbs | 16.82g | 11.91g | 2% |
| Magnesium | 18mg | 26mg | 2% |
| Vitamin B2 | 0.205mg | 0.18mg | 2% |
| Fructose | 1.32g | 2% | |
| Vitamin C | 0.5mg | 1.8mg | 1% |
| Manganese | 0.187mg | 0.167mg | 1% |
| Saturated fat | 3.689g | 3.446g | 1% |
| Protein per 100 calories | 5.9g | 4.7g | N/A |
| Calories per 10 g protein | 169kcal | 211kcal | N/A |
| Weight per 100 calories | 47g | 71g | N/A |
| Unsaturated / Saturated Fat ratio | 1.5 | 1 | N/A |
| Net carbs | 15.52g | 11.91g | N/A |
| Potassium | 195mg | 210mg | 0% |
| Sodium | 395mg | 385mg | 0% |
| Vitamin B6 | 0.114mg | 0.11mg | 0% |
| Tryptophan | 0.133mg | 0.075mg | 0% |
| Threonine | 0.459mg | 0.254mg | 0% |
| Isoleucine | 0.459mg | 0.311mg | 0% |
| Leucine | 0.827mg | 0.549mg | 0% |
| Lysine | 0.769mg | 0.486mg | 0% |
| Methionine | 0.24mg | 0.145mg | 0% |
| Phenylalanine | 0.461mg | 0.277mg | 0% |
| Valine | 0.524mg | 0.343mg | 0% |
| Histidine | 0.301mg | 0.201mg | 0% |
Macronutrient Comparison
Macronutrient breakdown side-by-side comparison
Protein:
12.63 g
Fats:
10.6 g
Carbs:
16.82 g
Water:
58.41 g
Other:
1.54 g
Protein:
6.68 g
Fats:
7.46 g
Carbs:
11.91 g
Water:
72.35 g
Other:
1.6 g
| Contains more ProteinProtein | +89.1% |
| Contains more FatsFats | +42.1% |
| Contains more CarbsCarbs | +41.2% |
| Contains more WaterWater | +23.9% |
~equal in
Other
~1.6g
Fat Type Comparison
Fat type breakdown side-by-side comparison
Saturated fat:
Sat. Fat
3.689 g
Monounsaturated fat:
Mono. Fat
4.077 g
Polyunsaturated fat:
Poly. Fat
1.55 g
Saturated fat:
Sat. Fat
3.446 g
Monounsaturated fat:
Mono. Fat
2.606 g
Polyunsaturated fat:
Poly. Fat
0.883 g
| Contains more Mono. FatMonounsaturated fat | +56.4% |
| Contains more Poly. FatPolyunsaturated fat | +75.5% |
~equal in
Saturated fat
~3.446g


