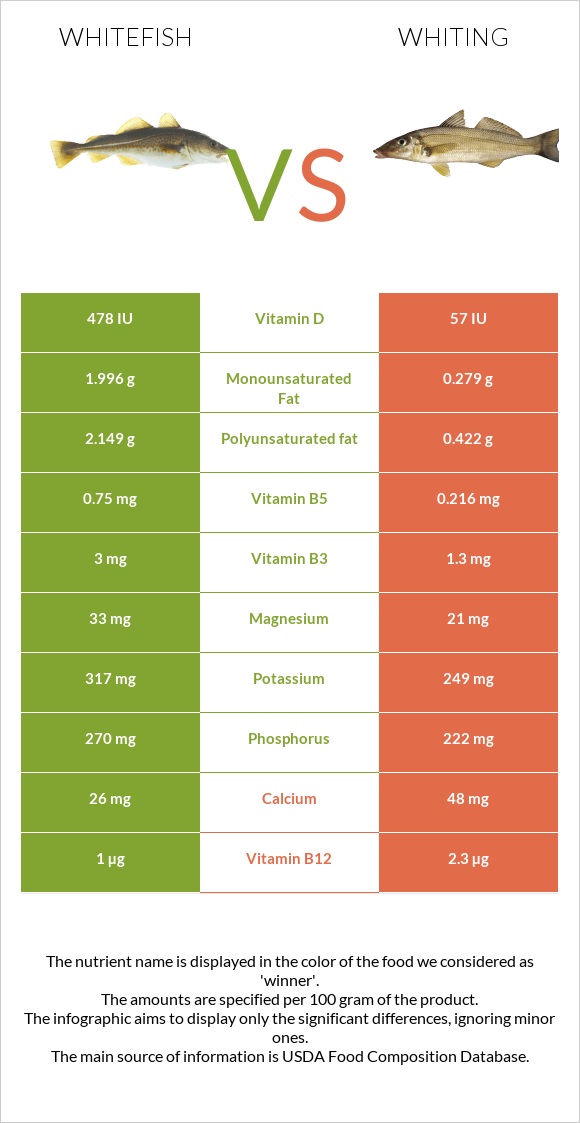
A recap on the differences between whitefish and whiting Whitefish has more phosphorus, vitamin B3, vitamin B6, vitamin B5, vitamin B1, vitamin B2, and copper; however, whiting is higher in vitamin B12 and selenium. Whiting covers your daily vitamin B12 needs 56% more than whitefish. Whiting contains 4 times less vitamin B5 than whitefish. Whitefish contains 0.865mg of vitamin B5, while whiting contains 0.216mg. Food varieties used in this article are Fish, whitefish, mixed species, cooked, dry heat and Fish, whiting, mixed species, raw .
Infographic
Mineral Comparison
Mineral comparison score is based on the number of minerals by which one or the other food is richer. The "coverage" charts below show how much of the daily needs can be covered by 300 grams of the food.
7
100 g
300 g
3 oz - 85g 1 fillet - 154g
Magnesium
Magnesium
Calcium
Calcium
Potassium
Potassium
Iron
Iron
Copper
Copper
Zinc
Zinc
Phosphorus
Phosphorus
Sodium
Sodium
Manganese
Manganese
Selenium
Selenium
30%
9.9%
36%
18%
31%
35%
148%
8.5%
11%
88%
3
100 g
300 g
3 oz - 85g 1 fillet - 92g
Magnesium
Magnesium
Calcium
Calcium
Potassium
Potassium
Iron
Iron
Copper
Copper
Zinc
Zinc
Phosphorus
Phosphorus
Sodium
Sodium
Manganese
Manganese
Selenium
Selenium
15%
14%
22%
13%
10%
24%
95%
9.4%
14%
175%
Vitamin Comparison
Vitamin comparison score is based on the number of vitamins by which one or the other food is richer. The "coverage" charts below show how much of the daily needs can be covered by 300 grams of the food.
7
100 g
300 g
3 oz - 85g 1 fillet - 154g
Vitamin C
Vit. C
Vitamin D
Vit. D
Vitamin A
Vit. A
Vitamin E
Vit. E
Vitamin B1
Vit. B1
Vitamin B2
Vit. B2
Vitamin B3
Vit. B3
Vitamin B5
Vit. B5
Vitamin B6
Vit. B6
Vitamin B12
Vit. B12
Vitamin K
Vit. K
Folate
Folate
0%
0%
13%
0%
43%
36%
72%
52%
80%
120%
0%
13%
4
100 g
300 g
3 oz - 85g 1 fillet - 92g
Vitamin C
Vit. C
Vitamin D
Vit. D
Vitamin A
Vit. A
Vitamin E
Vit. E
Vitamin B1
Vit. B1
Vitamin B2
Vit. B2
Vitamin B3
Vit. B3
Vitamin B5
Vit. B5
Vitamin B6
Vit. B6
Vitamin B12
Vit. B12
Vitamin K
Vit. K
Folate
Folate
0%
21%
10%
6%
14%
11%
24%
13%
36%
288%
0.25%
9.8%
All nutrients comparison - raw data values
Nutrient
DV% diff.
Vitamin B12
0.96µg
2.3µg
56%
Selenium
16.2µg
32.1µg
29%
Phosphorus
346mg
222mg
18%
Vitamin B3
3.846mg
1.3mg
16%
Polyunsaturated fat
2.755g
0.422g
16%
Vitamin B6
0.346mg
0.156mg
15%
Vitamin B5
0.865mg
0.216mg
13%
Protein
24.47g
18.31g
12%
Choline
65mg
12%
Fats
7.51g
1.31g
10%
Vitamin B1
0.171mg
0.056mg
10%
Vitamin B2
0.154mg
0.046mg
8%
Vitamin D*
57 IU
7%
Vitamin D
1.4µg
7%
Copper
0.092mg
0.031mg
7%
Monounsaturated fat
2.559g
0.279g
6%
Magnesium
42mg
21mg
5%
Potassium
406mg
249mg
5%
Calories
172kcal
90kcal
4%
Zinc
1.27mg
0.88mg
4%
Saturated fat
1.162g
0.247g
4%
Cholesterol
77mg
67mg
3%
Calcium
33mg
48mg
2%
Iron
0.47mg
0.34mg
2%
Vitamin E
0.3mg
2%
Vitamin A
39µg
30µg
1%
Manganese
0.086mg
0.104mg
1%
Folate
17µg
13µg
1%
Protein per 100 calories
14g
20g
N/A
Calories per 10 g protein
70kcal
49kcal
N/A
Weight per 100 calories
58g
111g
N/A
Unsaturated / Saturated Fat ratio
4.6
2.8
N/A
Sodium
65mg
72mg
0%
Vitamin K
0.1µg
0%
Tryptophan
0.274mg
0.205mg
0%
Threonine
1.073mg
0.803mg
0%
Isoleucine
1.128mg
0.844mg
0%
Leucine
1.989mg
1.488mg
0%
Lysine
2.248mg
1.682mg
0%
Methionine
0.724mg
0.542mg
0%
Phenylalanine
0.955mg
0.715mg
0%
Valine
1.261mg
0.943mg
0%
Histidine
0.721mg
0.539mg
0%
Omega-3 - EPA
0.406g
0.093g
N/A
Omega-3 - DHA
1.206g
0.131g
N/A
Omega-3 - DPA
0.209g
0.018g
N/A
Macronutrient Comparison
Macronutrient breakdown side-by-side comparison
3
24%
8%
65%
3%
Protein:
24.47 g
Fats:
7.51 g
Carbs:
0 g
Water:
65.09 g
Other:
2.93 g
1
18%
80%
Protein:
18.31 g
Fats:
1.31 g
Carbs:
0 g
Water:
80.27 g
Other:
0.11 g
Contains
more
Protein Protein
+33.6%
Contains
more
Fats Fats
+473.3%
Contains
more
Other Other
+2563.6%
Contains
more
Water Water
+23.3%
Fat Type Comparison
Fat type breakdown side-by-side comparison
2
18%
40%
43%
Saturated fat:
Sat. Fat
1.162 g
Monounsaturated fat:
Mono. Fat
2.559 g
Polyunsaturated fat:
Poly. Fat
2.755 g
1
26%
29%
45%
Saturated fat:
Sat. Fat
0.247 g
Monounsaturated fat:
Mono. Fat
0.279 g
Polyunsaturated fat:
Poly. Fat
0.422 g
Contains
more
Mono. Fat Monounsaturated fat
+817.2%
Contains
more
Poly. Fat Polyunsaturated fat
+552.8%
Contains
less
Sat. Fat Saturated fat
-78.7%