Yogurt, Greek, nonfat, vanilla, CHOBANI vs. Yogurt, Greek, vanilla, lowfat — In-Depth Nutrition Comparison
Compare
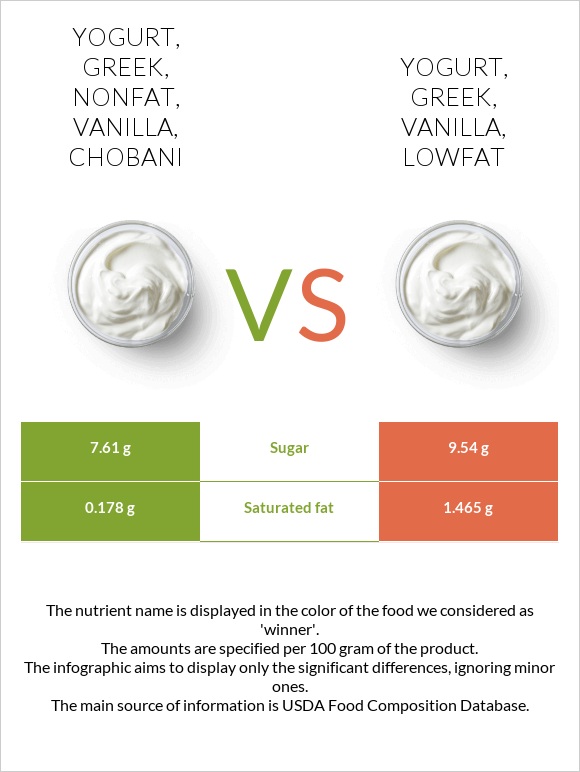
Important differences between yogurt, Greek, nonfat, vanilla, CHOBANI and yogurt, Greek, vanilla, lowfat
The food varieties used in the comparison are Yogurt, Greek, nonfat, vanilla, CHOBANI and Yogurt, Greek, vanilla, lowfat.
Infographic
Infographic link
Mineral Comparison
Mineral comparison score is based on the number of minerals by which one or the other food is richer. The "coverage" charts below show how much of the daily needs can be covered by 300 grams of the food.
| Contains more IronIron | +25% |
| Contains less SodiumSodium | -10% |
Vitamin Comparison
Vitamin comparison score is based on the number of vitamins by which one or the other food is richer. The "coverage" charts below show how much of the daily needs can be covered by 300 grams of the food.
| Contains more Vitamin B1Vitamin B1 | +35.7% |
All nutrients comparison - raw data values
| Nutrient |  |
|
DV% diff. |
| Vitamin A | 110µg | 12% | |
| Saturated fat | 0.178g | 1.465g | 6% |
| Choline | 33.4mg | 6% | |
| Vitamin D | 0.9µg | 5% | |
| Fats | 0.22g | 2.5g | 4% |
| Vitamin D | 35 IU | 4% | |
| Vitamin B12 | 0.7µg | 0.64µg | 3% |
| Fructose | 0.47g | 1.92g | 2% |
| Cholesterol | 5mg | 2% | |
| Monounsaturated fat | 0.06g | 0.846g | 2% |
| Folate | 9µg | 2% | |
| Selenium | 10.6µg | 9.7µg | 2% |
| Polyunsaturated fat | 0.011g | 0.203g | 1% |
| Vitamin B2 | 0.233mg | 0.24mg | 1% |
| Vitamin B1 | 0.028mg | 0.038mg | 1% |
| Protein | 9.07g | 8.64g | 1% |
| Calories | 71kcal | 95kcal | 1% |
| Fiber | 0.3g | 0g | 1% |
| Phosphorus | 126mg | 119mg | 1% |
| Calcium | 106mg | 100mg | 1% |
| Net carbs | 7.79g | 9.54g | N/A |
| Carbs | 8.09g | 9.54g | 0% |
| Magnesium | 11mg | 10mg | 0% |
| Potassium | 130mg | 123mg | 0% |
| Iron | 0.05mg | 0.04mg | 0% |
| Sugar | 7.61g | 9.54g | N/A |
| Copper | 0.019mg | 0.018mg | 0% |
| Zinc | 0.49mg | 0.46mg | 0% |
| Sodium | 36mg | 40mg | 0% |
| Vitamin E | 0.02mg | 0% | |
| Manganese | 0.008mg | 0.008mg | 0% |
| Vitamin B3 | 0.217mg | 0.201mg | 0% |
| Vitamin B5 | 0.39mg | 0.386mg | 0% |
| Vitamin B6 | 0.053mg | 0.05mg | 0% |
| Vitamin K | 0.2µg | 0% | |
| Trans fat | 0.007g | 0g | N/A |
| Omega-3 - ALA | 0.001g | 0.005g | N/A |
| Omega-6 - Linoleic acid | 0.01g | 0.094g | N/A |
Macronutrient Comparison
Macronutrient breakdown side-by-side comparison
Protein:
9.07 g
Fats:
0.22 g
Carbs:
8.09 g
Water:
82.03 g
Other:
0.59 g
Protein:
8.64 g
Fats:
2.5 g
Carbs:
9.54 g
Water:
78.76 g
Other:
0.56 g
| Contains more FatsFats | +1036.4% |
| Contains more CarbsCarbs | +17.9% |
~equal in
Protein
~8.64g
~equal in
Water
~78.76g
~equal in
Other
~0.56g
Fat Type Comparison
Fat type breakdown side-by-side comparison
Saturated fat:
Sat. Fat
0.178 g
Monounsaturated fat:
Mono. Fat
0.06 g
Polyunsaturated fat:
Poly. Fat
0.011 g
Saturated fat:
Sat. Fat
1.465 g
Monounsaturated fat:
Mono. Fat
0.846 g
Polyunsaturated fat:
Poly. Fat
0.203 g
| Contains less Sat. FatSaturated fat | -87.8% |
| Contains more Mono. FatMonounsaturated fat | +1310% |
| Contains more Poly. FatPolyunsaturated fat | +1745.5% |
Carbohydrate type comparison
Carbohydrate type breakdown side-by-side comparison
Starch:
0 g
Sucrose:
3.44 g
Glucose:
0.3 g
Fructose:
0.47 g
Lactose:
2.72 g
Maltose:
0 g
Galactose:
0.68 g
Starch:
0 g
Sucrose:
4.07 g
Glucose:
0.32 g
Fructose:
1.92 g
Lactose:
2.63 g
Maltose:
0 g
Galactose:
0.6 g
| Contains more GalactoseGalactose | +13.3% |
| Contains more SucroseSucrose | +18.3% |
| Contains more FructoseFructose | +308.5% |
~equal in
Starch
~0g
~equal in
Glucose
~0.32g
~equal in
Lactose
~2.63g
~equal in
Maltose
~0g