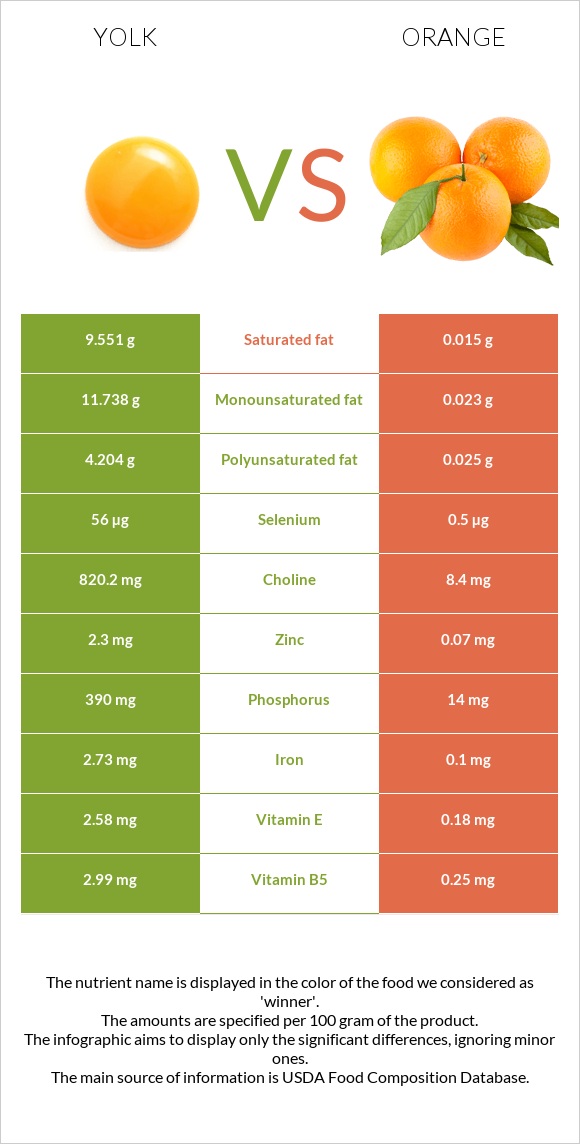
A recap on the differences between yolk and oranges Yolk has more choline, selenium, vitamin B12, vitamin B5, phosphorus, vitamin B2, and iron; however, oranges are higher in vitamin C. Yolk covers your daily cholesterol needs 362% more than oranges. Oranges have less cholesterol. The glycemic index of oranges is higher. Food varieties used in this article are Egg, yolk, raw, fresh and Oranges, raw, all commercial varieties .
Infographic
Mineral Comparison
Mineral comparison score is based on the number of minerals by which one or the other food is richer. The "coverage" charts below show how much of the daily needs can be covered by 300 grams of the food.
7
100 g
300 g
1 large - 17g 1 cup - 243g
Magnesium
Magnesium
Calcium
Calcium
Potassium
Potassium
Iron
Iron
Copper
Copper
Zinc
Zinc
Phosphorus
Phosphorus
Sodium
Sodium
Manganese
Manganese
Selenium
Selenium
3.6%
39%
9.6%
102%
26%
63%
167%
6.3%
7.2%
305%
3
100 g
300 g
1 small (2-3/8" dia) - 96g 1 fruit (2-5/8" dia) - 131g 1 cup, sections - 180g 1 large (3-1/16" dia) - 184g
Magnesium
Magnesium
Calcium
Calcium
Potassium
Potassium
Iron
Iron
Copper
Copper
Zinc
Zinc
Phosphorus
Phosphorus
Sodium
Sodium
Manganese
Manganese
Selenium
Selenium
7.1%
12%
16%
3.8%
15%
1.9%
6%
0%
3.3%
2.7%
Vitamin Comparison
Vitamin comparison score is based on the number of vitamins by which one or the other food is richer. The "coverage" charts below show how much of the daily needs can be covered by 300 grams of the food.
10
100 g
300 g
1 large - 17g 1 cup - 243g
Vitamin C
Vit. C
Vitamin D
Vit. D
Vitamin A
Vit. A
Vitamin E
Vit. E
Vitamin B1
Vit. B1
Vitamin B2
Vit. B2
Vitamin B3
Vit. B3
Vitamin B5
Vit. B5
Vitamin B6
Vit. B6
Vitamin B12
Vit. B12
Vitamin K
Vit. K
Folate
Folate
0%
81%
127%
52%
44%
122%
0.45%
179%
81%
244%
1.8%
110%
2
100 g
300 g
1 small (2-3/8" dia) - 96g 1 fruit (2-5/8" dia) - 131g 1 cup, sections - 180g 1 large (3-1/16" dia) - 184g
Vitamin C
Vit. C
Vitamin D
Vit. D
Vitamin A
Vit. A
Vitamin E
Vit. E
Vitamin B1
Vit. B1
Vitamin B2
Vit. B2
Vitamin B3
Vit. B3
Vitamin B5
Vit. B5
Vitamin B6
Vit. B6
Vitamin B12
Vit. B12
Vitamin K
Vit. K
Folate
Folate
177%
0%
3.7%
3.6%
22%
9.2%
5.3%
15%
14%
0%
0%
23%
All nutrients comparison - raw data values
Nutrient
DV% diff.
Cholesterol
1085mg
0mg
362%
Choline
820.2mg
8.4mg
148%
Selenium
56µg
0.5µg
101%
Vitamin B12
1.95µg
0µg
81%
Vitamin C
0mg
53.2mg
59%
Vitamin B5
2.99mg
0.25mg
55%
Phosphorus
390mg
14mg
54%
Saturated fat
9.551g
0.015g
43%
Fats
26.54g
0.12g
41%
Vitamin A
381µg
11µg
41%
Vitamin B2
0.528mg
0.04mg
38%
Iron
2.73mg
0.1mg
33%
Protein
15.86g
0.94g
30%
Folate
146µg
30µg
29%
Monounsaturated fat
11.738g
0.023g
29%
Polyunsaturated fat
4.204g
0.025g
28%
Vitamin D*
218 IU
0 IU
27%
Vitamin D
5.4µg
0µg
27%
Vitamin B6
0.35mg
0.06mg
22%
Zinc
2.3mg
0.07mg
20%
Vitamin E
2.58mg
0.18mg
16%
Calories
322kcal
47kcal
14%
Fiber
0g
2.4g
10%
Calcium
129mg
40mg
9%
Vitamin B1
0.176mg
0.087mg
7%
Copper
0.077mg
0.045mg
4%
Carbs
3.59g
11.75g
3%
Potassium
109mg
181mg
2%
Sodium
48mg
0mg
2%
Vitamin B3
0.024mg
0.282mg
2%
Magnesium
5mg
10mg
1%
Manganese
0.055mg
0.025mg
1%
Vitamin K
0.7µg
0µg
1%
Protein per 100 calories
4.9g
2g
N/A
Calories per 10 g protein
203kcal
500kcal
N/A
Weight per 100 calories
31g
213g
N/A
Unsaturated / Saturated Fat ratio
1.7
3.2
N/A
Net carbs
3.59g
9.35g
N/A
Sugar
0.56g
9.35g
N/A
Tryptophan
0.177mg
0.009mg
0%
Threonine
0.687mg
0.015mg
0%
Isoleucine
0.866mg
0.025mg
0%
Leucine
1.399mg
0.023mg
0%
Lysine
1.217mg
0.047mg
0%
Methionine
0.378mg
0.02mg
0%
Phenylalanine
0.681mg
0.031mg
0%
Valine
0.949mg
0.04mg
0%
Histidine
0.416mg
0.018mg
0%
Fructose
0.07g
0%
Omega-3 - EPA
0.011g
0g
N/A
Omega-3 - DHA
0.114g
0g
N/A
Macronutrient Comparison
Macronutrient breakdown side-by-side comparison
3
16%
27%
4%
52%
2%
Protein:
15.86 g
Fats:
26.54 g
Carbs:
3.59 g
Water:
52.31 g
Other:
1.7 g
2
12%
87%
Protein:
0.94 g
Fats:
0.12 g
Carbs:
11.75 g
Water:
86.75 g
Other:
0.44 g
Contains
more
Protein Protein
+1587.2%
Contains
more
Fats Fats
+22016.7%
Contains
more
Other Other
+286.4%
Contains
more
Carbs Carbs
+227.3%
Contains
more
Water Water
+65.8%
Fat Type Comparison
Fat type breakdown side-by-side comparison
2
37%
46%
16%
Saturated fat:
Sat. Fat
9.551 g
Monounsaturated fat:
Mono. Fat
11.738 g
Polyunsaturated fat:
Poly. Fat
4.204 g
1
24%
37%
40%
Saturated fat:
Sat. Fat
0.015 g
Monounsaturated fat:
Mono. Fat
0.023 g
Polyunsaturated fat:
Poly. Fat
0.025 g
Contains
more
Mono. Fat Monounsaturated fat
+50934.8%
Contains
more
Poly. Fat Polyunsaturated fat
+16716%
Contains
less
Sat. Fat Saturated fat
-99.8%