Համեմատել Tilsit cheese և Provolone (պանիր) սննդամթերքների վիտամինները և միներալները
Համեմատել
Infographic
Infographic link
Mineral Comparison
Mineral comparison score is based on the number of minerals by which one or the other food is richer. The "coverage" charts below show how much of the daily needs can be covered by 300 grams of the food.
| Պարունակում է ավելի քիչ ՆատրիումՆատրիում | -14% |
| Պարունակում է ավելի շատ ՄանգանՄանգան | +30% |
| Պարունակում է ավելի շատ ՄագնեզիումՄագնեզիում | +115.4% |
| Պարունակում է ավելի շատ ԿալիումԿալիում | +112.3% |
| Պարունակում է ավելի շատ ԵրկաթԵրկաթ | +126.1% |
Vitamin Comparison
Vitamin comparison score is based on the number of vitamins by which one or the other food is richer. The "coverage" charts below show how much of the daily needs can be covered by 300 grams of the food.
| Պարունակում է ավելի շատ Վիտամին B1Վիտամին B1 | +221.1% |
| Պարունակում է ավելի շատ Վիտամին B2Վիտամին B2 | +11.8% |
| Պարունակում է ավելի շատ Վիտամին B3Վիտամին B3 | +31.4% |
| Պարունակում է ավելի շատ Վիտամին B12Վիտամին B12 | +43.8% |
| Պարունակում է ավելի շատ Folate, totalFolate, total | +100% |
| Պարունակում է ավելի շատ Վիտամին B5Վիտամին B5 | +37.6% |
| Պարունակում է ավելի շատ Վիտամին B6Վիտամին B6 | +12.3% |
All nutrients comparison - raw data values
| Nutrient |  |
 |
DV% diff. |
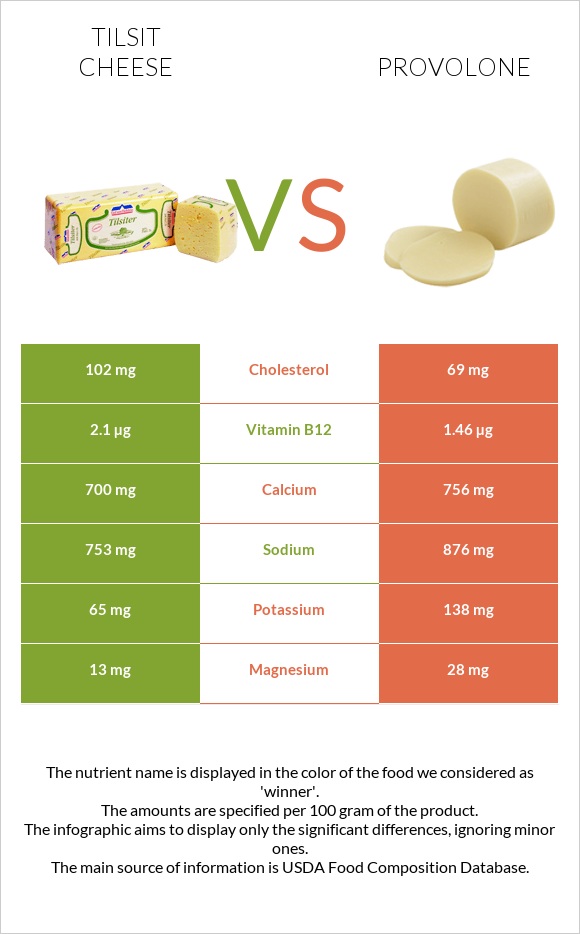
| Վիտամին B12 | 2.1µg | 1.46µg | 27% |
| Խոլեստերին | 102mg | 69mg | 11% |
| Կալցիում | 700mg | 756mg | 6% |
| Նատրիում | 753mg | 876mg | 5% |
| Մագնեզիում | 13mg | 28mg | 4% |
| Երկաթ | 0.23mg | 0.52mg | 4% |
| Վիտամին B1 | 0.061mg | 0.019mg | 4% |
| Վիտամին D | 20 IU | 3% | |
| Վիտամին D | 0.5µg | 3% | |
| Վիտամին B2 | 0.359mg | 0.321mg | 3% |
| Վիտամին B5 | 0.346mg | 0.476mg | 3% |
| Folate, total | 20µg | 10µg | 3% |
| Choline, total | 15.4mg | 3% | |
| Սպիտակուցներ | 24.41g | 25.58g | 2% |
| Կալիում | 65mg | 138mg | 2% |
| Ցինկ | 3.5mg | 3.23mg | 2% |
| Վիտամին E | 0.23mg | 2% | |
| Վիտամին K | 2.2µg | 2% | |
| Կալորիականություն | 340kcal | 351kcal | 1% |
| Ճարպեր | 25.98g | 26.62g | 1% |
| Ֆոսֆոր | 500mg | 496mg | 1% |
| Վիտամին A | 249µg | 236µg | 1% |
| Վիտամին B6 | 0.065mg | 0.073mg | 1% |
| Հագեցած ճարպ | 16.775g | 17.078g | 1% |
| Մոնոչհագեցած ճարպ | 7.136g | 7.393g | 1% |
| Protein per 100 calories | 7.2g | 7.3g | N/A |
| Calories per 10 g protein | 139kcal | 137kcal | N/A |
| Weight per 100 calories | 29g | 28g | N/A |
| Unsaturated / Saturated Fat ratio | 0.47 | 0.48 | N/A |
| Զուտ ածխաջրեր | 1.88g | 2.14g | N/A |
| Ածխաջրեր | 1.88g | 2.14g | 0% |
| Շաքար | 0.56g | N/A | |
| Պղինձ | 0.026mg | 0.026mg | 0% |
| Մանգան | 0.013mg | 0.01mg | 0% |
| Սելեն | 14.5µg | 14.5µg | 0% |
| Վիտամին B3 | 0.205mg | 0.156mg | 0% |
| Պոլիչհագեցած ճարպ | 0.721g | 0.769g | 0% |
| Տրիպտոֆան | 0.352mg | 0.345mg | 0% |
| Տրեոնին | 0.899mg | 0.982mg | 0% |
| Իզոլեյցին | 1.484mg | 1.091mg | 0% |
| Լեյցին | 2.548mg | 2.297mg | 0% |
| Լիզին | 2.039mg | 2.646mg | 0% |
| Մեթիոնին | 0.754mg | 0.686mg | 0% |
| Ֆենիլալանին | 1.358mg | 1.287mg | 0% |
| Վալին | 1.752mg | 1.64mg | 0% |
| Հիստիդին | 0.704mg | 1.115mg | 0% |
Macronutrient Comparison
Macronutrient breakdown side-by-side comparison
Սպիտակուցներ:
24.41 գ
Ճարպեր:
25.98 գ
Ածխաջրեր:
1.88 գ
Ջուր:
42.86 գ
Այլ:
4.87 գ
Սպիտակուցներ:
25.58 գ
Ճարպեր:
26.62 գ
Ածխաջրեր:
2.14 գ
Ջուր:
40.95 գ
Այլ:
4.71 գ
| Պարունակում է ավելի շատ ԱծխաջրերԱծխաջրեր | +13.8% |
հավասար
Սպիտակուցներ
~25.58g
հավասար
Ճարպեր
~26.62g
հավասար
Ջուր
~40.95g
հավասար
Այլ
~4.71գ
Fat Type Comparison
Fat type breakdown side-by-side comparison
Հագեցած ճարպ:
Հագեցած ճարպ
16.775 գ
Մոնոչհագեցած ճարպ:
Մոնոչհագեցած ճարպ
7.136 գ
Պոլիչհագեցած ճարպ:
Պոլիչհագեցած ճարպ
0.721 գ
Հագեցած ճարպ:
Հագեցած ճարպ
17.078 գ
Մոնոչհագեցած ճարպ:
Մոնոչհագեցած ճարպ
7.393 գ
Պոլիչհագեցած ճարպ:
Պոլիչհագեցած ճարպ
0.769 գ
հավասար
Հագեցած ճարպ
~17.078g
հավասար
Մոնոչհագեցած ճարպ
~7.393g
հավասար
Պոլիչհագեցած ճարպ
~0.769g


