Համեմատել Սնիկերս և Նարանխիլա սննդամթերքների վիտամինները և միներալները
Համեմատել
Infographic
Infographic link
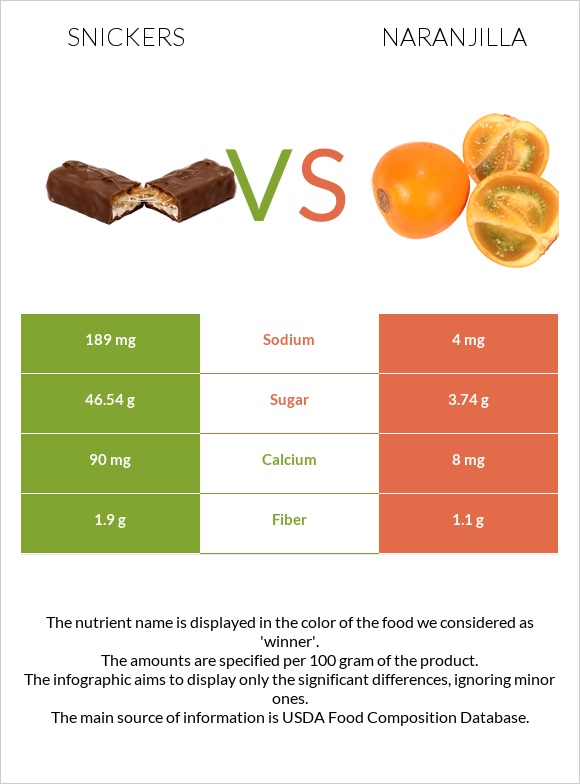
Mineral Comparison
Mineral comparison score is based on the number of minerals by which one or the other food is richer. The "coverage" charts below show how much of the daily needs can be covered by 300 grams of the food.
Vitamin comparison score is based on the number of vitamins by which one or the other food is richer. The "coverage" charts below show how much of the daily needs can be covered by 300 grams of the food.
Էջում ներկայացված բոլոր արժեքների աղբյուրը (բացառությամբ հիմնական հոդվածի, որի աղբյուրները ներկայացված են առանձին, եթե առկա են) ԱՄՆ-ի գյուղդեպարտամենտի տվյալների բազան է: Էջում ներկայացված կոնկրետ սննդամթերքների հղումները բերված են ստորև