
Beef, ground, 70% lean meat / 30% fat, patty, cooked, broiled vs. Beef tenderloin — In-Depth Nutrition Comparison
Compare
What are the main differences between beef, ground, 70% lean meat / 30% fat, patty, cooked, broiled and beef tenderloin?
- Beef, ground, 70% lean meat / 30% fat, patty, cooked, broiled is richer in zinc, vitamin B12, vitamin B3, vitamin B5, and vitamin B6, while beef tenderloin is higher in iron, fats, vitamin B2, and copper.
- Beef, ground, 70% lean meat / 30% fat, patty, cooked, broiled's daily need coverage for zinc is 19% higher.
- Beef tenderloin has 3 times less vitamin B5 than beef, ground, 70% lean meat / 30% fat, patty, cooked, broiled. Beef, ground, 70% lean meat / 30% fat, patty, cooked, broiled has 0.658mg of vitamin B5, while beef tenderloin has 0.25mg.
- Beef, ground, 70% lean meat / 30% fat, patty, cooked, broiled is lower in saturated fat.
We used Beef, ground, 70% lean meat / 30% fat, patty, cooked, broiled and Beef, tenderloin, roast, separable lean, and fat, trimmed to 1/8" fat, all grades, cooked, roasted types in this comparison.
Infographic
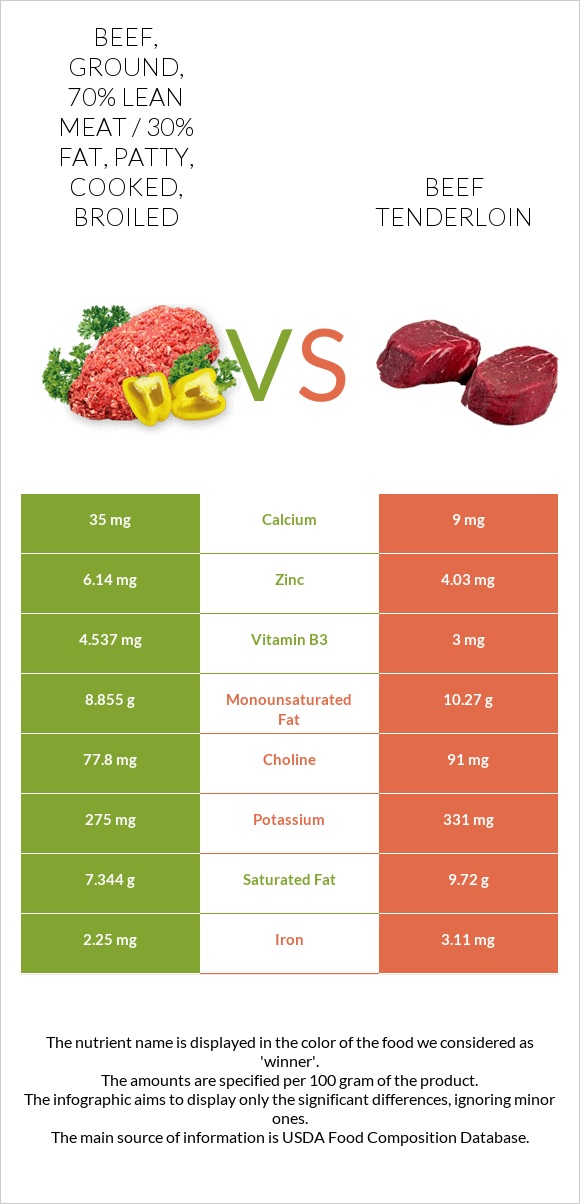
Infographic link
Mineral Comparison
The mineral comparison score is based on which food has a more favorable amount of each mineral. The �coverage� charts below show how much of the daily mineral needs are covered by the selected amount of each food.
| Contains more CalciumCalcium | +288.9% |
| Contains more ZincZinc | +52.4% |
| Contains more MagnesiumMagnesium | +15.8% |
| Contains more PotassiumPotassium | +20.4% |
| Contains more IronIron | +38.2% |
| Contains more CopperCopper | +78.3% |
| Contains less SodiumSodium | -29.6% |
| Contains more ManganeseManganese | +55.6% |
Vitamin Comparison
The vitamin comparison score is based on the number of vitamins in which one food is richer than the other. The �coverage� charts below show how much of the daily vitamin needs are covered by the selected amount of each food.
| Contains more Vitamin AVitamin A | +∞% |
| Contains more Vitamin EVitamin E | +∞% |
| Contains more Vitamin B3Vitamin B3 | +51.2% |
| Contains more Vitamin B5Vitamin B5 | +163.2% |
| Contains more Vitamin B6Vitamin B6 | +34.4% |
| Contains more Vitamin B12Vitamin B12 | +17.9% |
| Contains more Vitamin KVitamin K | +∞% |
| Contains more FolateFolate | +37.5% |
| Contains more Vitamin B1Vitamin B1 | +76.5% |
| Contains more Vitamin B2Vitamin B2 | +47.7% |
All nutrients comparison - raw data values
| Nutrient |  |
 |
DV% diff. |
| Zinc | 6.14mg | 4.03mg | 19% |
| Vitamin B12 | 2.9µg | 2.46µg | 18% |
| Iron | 2.25mg | 3.11mg | 11% |
| Saturated fat | 7.344g | 9.72g | 11% |
| Vitamin B3 | 4.537mg | 3mg | 10% |
| Fats | 18.66g | 24.6g | 9% |
| Vitamin B5 | 0.658mg | 0.25mg | 8% |
| Vitamin B6 | 0.336mg | 0.25mg | 7% |
| Copper | 0.069mg | 0.123mg | 6% |
| Vitamin B2 | 0.176mg | 0.26mg | 6% |
| Monounsaturated fat | 8.855g | 10.27g | 4% |
| Protein | 25.38g | 23.9g | 3% |
| Calcium | 35mg | 9mg | 3% |
| Phosphorus | 185mg | 203mg | 3% |
| Selenium | 21.5µg | 22.9µg | 3% |
| Vitamin B1 | 0.051mg | 0.09mg | 3% |
| Vitamin K | 3µg | 3% | |
| Polyunsaturated fat | 0.493g | 1g | 3% |
| Omega-3 (ALA) | 0.044g | 3% | |
| Calories | 277kcal | 324kcal | 2% |
| Potassium | 275mg | 331mg | 2% |
| Choline | 77.8mg | 91mg | 2% |
| Cholesterol | 88mg | 85mg | 1% |
| Magnesium | 19mg | 22mg | 1% |
| Sodium | 81mg | 57mg | 1% |
| Vitamin E | 0.12mg | 1% | |
| Folate | 11µg | 8µg | 1% |
| Protein per 100 calories | 9.2g | 7.4g | N/A |
| Calories per 10 g protein | 109kcal | 136kcal | N/A |
| Weight per 100 calories | 36g | 31g | N/A |
| Unsaturated / Saturated Fat ratio | 1.3 | 1.2 | N/A |
| Vitamin D* | 2 IU | 0% | |
| Vitamin A | 3µg | 0µg | 0% |
| Manganese | 0.009mg | 0.014mg | 0% |
| Trans fat | 1.168g | N/A | |
| Tryptophan | 0.129mg | 0.268mg | 0% |
| Threonine | 0.982mg | 1.044mg | 0% |
| Isoleucine | 1.122mg | 1.075mg | 0% |
| Leucine | 1.978mg | 1.889mg | 0% |
| Lysine | 2.101mg | 1.989mg | 0% |
| Methionine | 0.653mg | 0.612mg | 0% |
| Phenylalanine | 0.99mg | 0.933mg | 0% |
| Valine | 1.246mg | 1.163mg | 0% |
| Histidine | 0.824mg | 0.818mg | 0% |
| Omega-6 (Gamma-linolenic acid) | 0.012g | N/A |
Macronutrient Comparison
Macronutrient breakdown side-by-side comparison
Protein:
25.38 g
Fats:
18.66 g
Carbs:
0 g
Water:
55.85 g
Other:
0.11 g
Protein:
23.9 g
Fats:
24.6 g
Carbs:
0 g
Water:
48.37 g
Other:
3.13 g
| Contains more WaterWater | +15.5% |
| Contains more FatsFats | +31.8% |
~equal in
Protein
~23.9g
~equal in
Carbs
~0g
Fat Type Comparison
Fat type breakdown side-by-side comparison
Saturated fat:
Sat. Fat
7.344 g
Monounsaturated fat:
Mono. Fat
8.855 g
Polyunsaturated fat:
Poly. Fat
0.493 g
Saturated fat:
Sat. Fat
9.72 g
Monounsaturated fat:
Mono. Fat
10.27 g
Polyunsaturated fat:
Poly. Fat
1 g
| Contains less Sat. FatSaturated fat | -24.4% |
| Contains more Mono. FatMonounsaturated fat | +16% |
| Contains more Poly. FatPolyunsaturated fat | +102.8% |