
Beef broiled vs. Flax seeds — In-Depth Nutrition Comparison
Compare
How are beef broiled and flax seeds different?
- Beef broiled is richer in vitamin B12, while flax seeds are higher in vitamin B1, copper, fiber, manganese, magnesium, phosphorus, fats, and iron.
- Flax seeds cover your daily need for vitamin B1 133% more than beef broiled.
- Flax seeds are lower in cholesterol.
Beef, ground, 85% lean meat / 15% fat, patty, cooked, broiled and Seeds, flaxseed types were used in this article.
Infographic
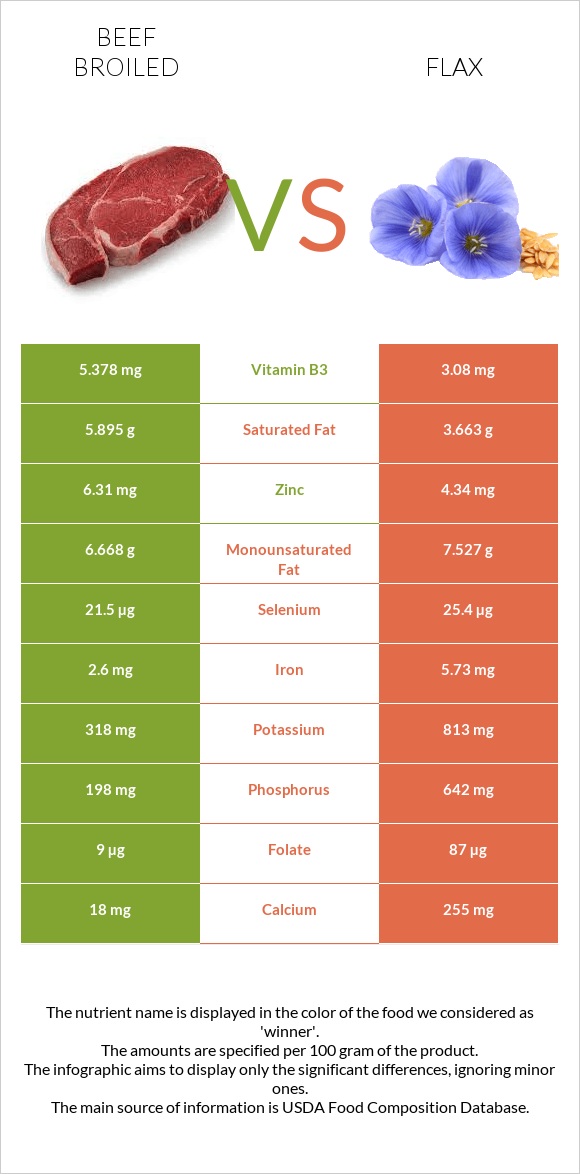
Infographic link
Mineral Comparison
The mineral comparison score is based on which food has a more favorable amount of each mineral. The �coverage� charts below show how much of the daily mineral needs are covered by the selected amount of each food.
| Contains more ZincZinc | +45.4% |
| Contains more MagnesiumMagnesium | +1766.7% |
| Contains more CalciumCalcium | +1316.7% |
| Contains more PotassiumPotassium | +155.7% |
| Contains more IronIron | +120.4% |
| Contains more CopperCopper | +1335.3% |
| Contains more PhosphorusPhosphorus | +224.2% |
| Contains less SodiumSodium | -58.3% |
| Contains more ManganeseManganese | +20583.3% |
| Contains more SeleniumSelenium | +18.1% |
Vitamin Comparison
The vitamin comparison score is based on the number of vitamins in which one food is richer than the other. The �coverage� charts below show how much of the daily vitamin needs are covered by the selected amount of each food.
| Contains more Vitamin AVitamin A | +∞% |
| Contains more Vitamin B3Vitamin B3 | +74.6% |
| Contains more Vitamin B12Vitamin B12 | +∞% |
| Contains more Vitamin CVitamin C | +∞% |
| Contains more Vitamin EVitamin E | +158.3% |
| Contains more Vitamin B1Vitamin B1 | +3473.9% |
| Contains more Vitamin B5Vitamin B5 | +49.7% |
| Contains more Vitamin B6Vitamin B6 | +23.8% |
| Contains more Vitamin KVitamin K | +258.3% |
| Contains more FolateFolate | +866.7% |
All nutrients comparison - raw data values
| Nutrient |  |
 |
DV% diff. |
| Polyunsaturated fat | 0.484g | 28.73g | 188% |
| Vitamin B1 | 0.046mg | 1.644mg | 133% |
| Copper | 0.085mg | 1.22mg | 126% |
| Vitamin B12 | 2.64µg | 0µg | 110% |
| Fiber | 0g | 27.3g | 109% |
| Manganese | 0.012mg | 2.482mg | 107% |
| Magnesium | 21mg | 392mg | 88% |
| Phosphorus | 198mg | 642mg | 63% |
| Fats | 15.41g | 42.16g | 41% |
| Iron | 2.6mg | 5.73mg | 39% |
| Cholesterol | 88mg | 0mg | 29% |
| Calcium | 18mg | 255mg | 24% |
| Folate | 9µg | 87µg | 20% |
| Zinc | 6.31mg | 4.34mg | 18% |
| Protein | 25.93g | 18.29g | 15% |
| Potassium | 318mg | 813mg | 15% |
| Calories | 250kcal | 534kcal | 14% |
| Vitamin B3 | 5.378mg | 3.08mg | 14% |
| Carbs | 0g | 28.88g | 10% |
| Saturated fat | 5.895g | 3.663g | 10% |
| Selenium | 21.5µg | 25.4µg | 7% |
| Vitamin B5 | 0.658mg | 0.985mg | 7% |
| Vitamin B6 | 0.382mg | 0.473mg | 7% |
| Vitamin K | 1.2µg | 4.3µg | 3% |
| Omega-3 (ALA) | 0.044g | 3% | |
| Sodium | 72mg | 30mg | 2% |
| Monounsaturated fat | 6.668g | 7.527g | 2% |
| Vitamin C | 0mg | 0.6mg | 1% |
| Vitamin E | 0.12mg | 0.31mg | 1% |
| Vitamin B2 | 0.176mg | 0.161mg | 1% |
| Choline | 82.4mg | 78.7mg | 1% |
| Protein per 100 calories | 10g | 3.4g | N/A |
| Calories per 10 g protein | 96kcal | 292kcal | N/A |
| Weight per 100 calories | 40g | 19g | N/A |
| Unsaturated / Saturated Fat ratio | 1.2 | 9.9 | N/A |
| Net carbs | 0g | 1.58g | N/A |
| Vitamin D* | 2 IU | 0 IU | 0% |
| Sugar | 0g | 1.55g | N/A |
| Vitamin A | 3µg | 0µg | 0% |
| Trans fat | 0.572g | N/A | |
| Tryptophan | 0.094mg | 0.297mg | 0% |
| Threonine | 0.72mg | 0.766mg | 0% |
| Isoleucine | 0.822mg | 0.896mg | 0% |
| Leucine | 1.45mg | 1.235mg | 0% |
| Lysine | 1.54mg | 0.862mg | 0% |
| Methionine | 0.478mg | 0.37mg | 0% |
| Phenylalanine | 0.725mg | 0.957mg | 0% |
| Valine | 0.914mg | 1.072mg | 0% |
| Histidine | 0.604mg | 0.472mg | 0% |
| Omega-3 (EPA) | 0.003g | 0g | N/A |
| Omega-3 (DHA) | 0.001g | 0g | N/A |
| Omega-3 (DPA) | 0.016g | 0g | N/A |
| Omega-6 (Gamma-linolenic acid) | 0.012g | N/A | |
| Omega-6 (Eicosadienoic acid) | 0g | 0.007g | N/A |
Macronutrient Comparison
Macronutrient breakdown side-by-side comparison
Protein:
25.93 g
Fats:
15.41 g
Carbs:
0 g
Water:
57.98 g
Other:
0.68 g
Protein:
18.29 g
Fats:
42.16 g
Carbs:
28.88 g
Water:
6.96 g
Other:
3.71 g
| Contains more ProteinProtein | +41.8% |
| Contains more WaterWater | +733% |
| Contains more FatsFats | +173.6% |
| Contains more CarbsCarbs | +∞% |
Fat Type Comparison
Fat type breakdown side-by-side comparison
Saturated fat:
Sat. Fat
5.895 g
Monounsaturated fat:
Mono. Fat
6.668 g
Polyunsaturated fat:
Poly. Fat
0.484 g
Saturated fat:
Sat. Fat
3.663 g
Monounsaturated fat:
Mono. Fat
7.527 g
Polyunsaturated fat:
Poly. Fat
28.73 g
| Contains less Sat. FatSaturated fat | -37.9% |
| Contains more Mono. FatMonounsaturated fat | +12.9% |
| Contains more Poly. FatPolyunsaturated fat | +5836% |