
Beef, variety meats and by-products, thymus, cooked, braised vs. Foie gras — In-Depth Nutrition Comparison
Compare
Significant differences between beef, variety meats and by-products, thymus, cooked, braised and foie gras
- Beef, variety meats, and by-products, thymus, cooked, braised has more vitamin C; however, foie gras is richer in vitamin B12, vitamin A, iron, selenium, copper, and fats.
- Foie gras covers your daily vitamin B12 needs 329% more than beef, variety meats, and by-products, thymus, cooked, braised.
- Foie gras has 15 times less vitamin C than beef, variety meats, and by-products, thymus, cooked, braised. Beef, variety meats, and by-products, thymus, cooked, braised has 30.2mg of vitamin C, while foie gras has 2mg.
- Foie gras contains less cholesterol.
Specific food types used in this comparison are Beef, variety meats, and by-products, thymus, cooked, braised and Pate de foie gras, canned (goose liver pate), smoked.
Infographic
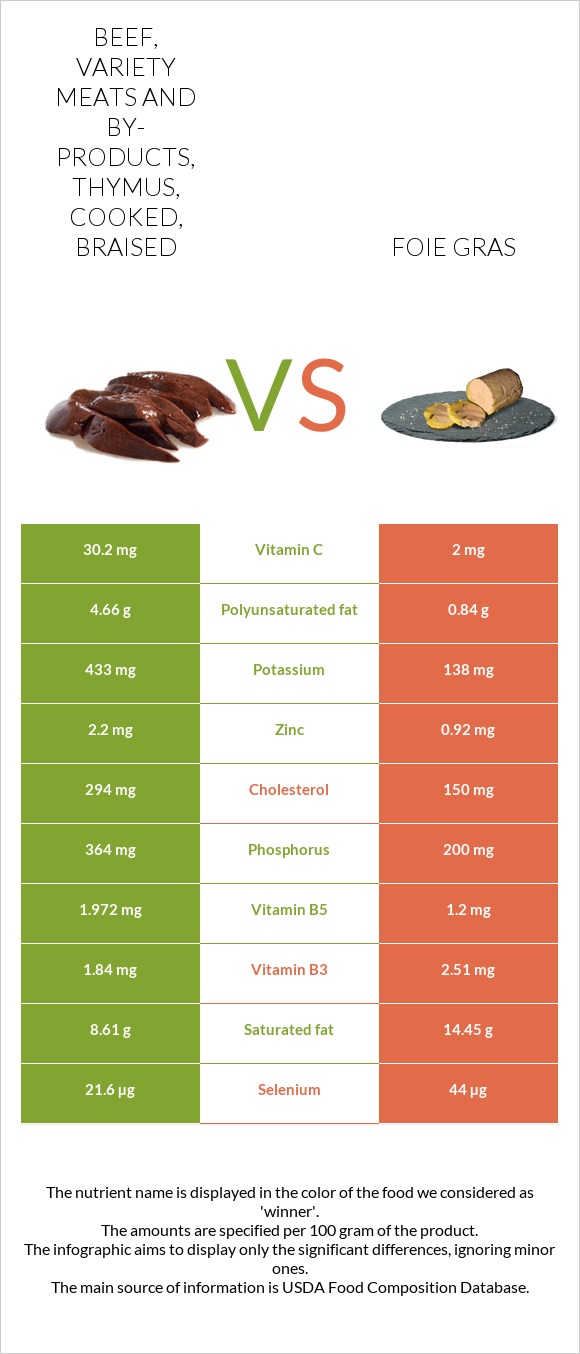
Infographic link
Mineral Comparison
The mineral comparison score is based on which food has a more favorable amount of each mineral. The �coverage� charts below show how much of the daily mineral needs are covered by the selected amount of each food.
| Contains more PotassiumPotassium | +213.8% |
| Contains more ZincZinc | +139.1% |
| Contains more PhosphorusPhosphorus | +82% |
| Contains less SodiumSodium | -83.4% |
| Contains more MagnesiumMagnesium | +30% |
| Contains more CalciumCalcium | +600% |
| Contains more IronIron | +269.1% |
| Contains more CopperCopper | +830.2% |
| Contains more ManganeseManganese | +21.2% |
| Contains more SeleniumSelenium | +103.7% |
Vitamin Comparison
The vitamin comparison score is based on the number of vitamins in which one food is richer than the other. The �coverage� charts below show how much of the daily vitamin needs are covered by the selected amount of each food.
| Contains more Vitamin CVitamin C | +1410% |
| Contains more Vitamin B5Vitamin B5 | +64.3% |
| Contains more Vitamin B6Vitamin B6 | +33.3% |
| Contains more Vitamin AVitamin A | +∞% |
| Contains more Vitamin B2Vitamin B2 | +32.9% |
| Contains more Vitamin B3Vitamin B3 | +36.4% |
| Contains more Vitamin B12Vitamin B12 | +522.5% |
| Contains more FolateFolate | +5900% |
All nutrients comparison - raw data values
| Nutrient |  |
 |
DV% diff. |
| Vitamin B12 | 1.51µg | 9.4µg | 329% |
| Vitamin A | 0µg | 1001µg | 111% |
| Iron | 1.49mg | 5.5mg | 50% |
| Cholesterol | 294mg | 150mg | 48% |
| Monounsaturated fat | 8.64g | 25.61g | 42% |
| Selenium | 21.6µg | 44µg | 41% |
| Copper | 0.043mg | 0.4mg | 40% |
| Vitamin C | 30.2mg | 2mg | 31% |
| Fats | 24.98g | 43.84g | 29% |
| Saturated fat | 8.61g | 14.45g | 27% |
| Sodium | 116mg | 697mg | 25% |
| Polyunsaturated fat | 4.66g | 0.84g | 25% |
| Phosphorus | 364mg | 200mg | 23% |
| Protein | 21.85g | 11.4g | 21% |
| Vitamin B5 | 1.972mg | 1.2mg | 15% |
| Folate | 1µg | 60µg | 15% |
| Zinc | 2.2mg | 0.92mg | 12% |
| Potassium | 433mg | 138mg | 9% |
| Calories | 319kcal | 462kcal | 7% |
| Calcium | 10mg | 70mg | 6% |
| Vitamin B2 | 0.225mg | 0.299mg | 6% |
| Vitamin B3 | 1.84mg | 2.51mg | 4% |
| Carbs | 0g | 4.67g | 2% |
| Vitamin B6 | 0.08mg | 0.06mg | 2% |
| Magnesium | 10mg | 13mg | 1% |
| Manganese | 0.099mg | 0.12mg | 1% |
| Protein per 100 calories | 6.8g | 2.5g | N/A |
| Calories per 10 g protein | 146kcal | 405kcal | N/A |
| Weight per 100 calories | 31g | 22g | N/A |
| Unsaturated / Saturated Fat ratio | 1.5 | 1.8 | N/A |
| Net carbs | 0g | 4.67g | N/A |
| Vitamin B1 | 0.084mg | 0.088mg | 0% |
| Tryptophan | 0.168mg | 0.161mg | 0% |
| Threonine | 0.79mg | 0.507mg | 0% |
| Isoleucine | 0.745mg | 0.606mg | 0% |
| Leucine | 1.458mg | 1.029mg | 0% |
| Lysine | 1.818mg | 0.863mg | 0% |
| Methionine | 0.304mg | 0.27mg | 0% |
| Phenylalanine | 0.626mg | 0.567mg | 0% |
| Valine | 0.947mg | 0.719mg | 0% |
| Histidine | 0.385mg | 0.303mg | 0% |
Macronutrient Comparison
Macronutrient breakdown side-by-side comparison
Protein:
21.85 g
Fats:
24.98 g
Carbs:
0 g
Water:
52.83 g
Other:
0.34 g
Protein:
11.4 g
Fats:
43.84 g
Carbs:
4.67 g
Water:
37.04 g
Other:
3.05 g
| Contains more ProteinProtein | +91.7% |
| Contains more WaterWater | +42.6% |
| Contains more FatsFats | +75.5% |
| Contains more CarbsCarbs | +∞% |
Fat Type Comparison
Fat type breakdown side-by-side comparison
Saturated fat:
Sat. Fat
8.61 g
Monounsaturated fat:
Mono. Fat
8.64 g
Polyunsaturated fat:
Poly. Fat
4.66 g
Saturated fat:
Sat. Fat
14.45 g
Monounsaturated fat:
Mono. Fat
25.61 g
Polyunsaturated fat:
Poly. Fat
0.84 g
| Contains less Sat. FatSaturated fat | -40.4% |
| Contains more Poly. FatPolyunsaturated fat | +454.8% |
| Contains more Mono. FatMonounsaturated fat | +196.4% |