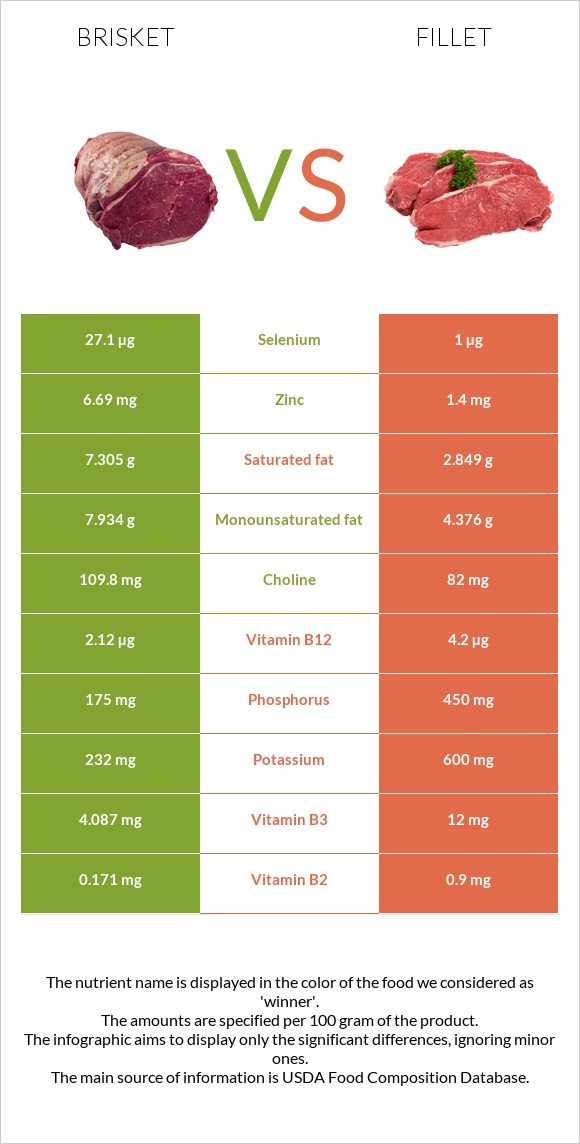
Significant differences between brisket and fillet Brisket has more zinc and selenium; however, fillet is richer in vitamin B6, copper, vitamin B1, vitamin B12, vitamin B2, vitamin B3, and phosphorus. Fillet covers your daily vitamin B6 needs 94% more than brisket. Specific food types used in this comparison are Beef, brisket, flat half, separable lean, and fat, trimmed to 1/8" fat, all grades, cooked, braised and Vegetarian fillets .
Infographic
Mineral Comparison
Mineral comparison score is based on the number of minerals by which one or the other food is richer. The "coverage" charts below show how much of the daily needs can be covered by 300 grams of the food.
5
100 g
300 g
3 oz - 85g 1 steak (yield from raw steak weighing 550 g) - 380g
Magnesium
Magnesium
Calcium
Calcium
Potassium
Potassium
Iron
Iron
Copper
Copper
Zinc
Zinc
Phosphorus
Phosphorus
Sodium
Sodium
Manganese
Manganese
Selenium
Selenium
14%
4.8%
20%
91%
33%
182%
75%
6.3%
1.3%
148%
5
100 g
300 g
1 fillet - 85g
Magnesium
Magnesium
Calcium
Calcium
Potassium
Potassium
Iron
Iron
Copper
Copper
Zinc
Zinc
Phosphorus
Phosphorus
Sodium
Sodium
Manganese
Manganese
Selenium
Selenium
16%
29%
53%
75%
308%
38%
193%
64%
0%
5.5%
Vitamin Comparison
Vitamin comparison score is based on the number of vitamins by which one or the other food is richer. The "coverage" charts below show how much of the daily needs can be covered by 300 grams of the food.
2
100 g
300 g
3 oz - 85g 1 steak (yield from raw steak weighing 550 g) - 380g
Vitamin C
Vit. C
Vitamin D
Vit. D
Vitamin A
Vit. A
Vitamin E
Vit. E
Vitamin B1
Vit. B1
Vitamin B2
Vit. B2
Vitamin B3
Vit. B3
Vitamin B5
Vit. B5
Vitamin B6
Vit. B6
Vitamin B12
Vit. B12
Vitamin K
Vit. K
Folate
Folate
0%
0%
0%
10%
15%
39%
77%
34%
65%
265%
4.5%
6.8%
7
100 g
300 g
1 fillet - 85g
Vitamin C
Vit. C
Vitamin D
Vit. D
Vitamin A
Vit. A
Vitamin E
Vit. E
Vitamin B1
Vit. B1
Vitamin B2
Vit. B2
Vitamin B3
Vit. B3
Vitamin B5
Vit. B5
Vitamin B6
Vit. B6
Vitamin B12
Vit. B12
Vitamin K
Vit. K
Folate
Folate
0%
0%
0%
69%
275%
208%
225%
0%
346%
525%
0%
77%
All nutrients comparison - raw data values
Nutrient
DV% diff.
Vitamin B6
0.282mg
1.5mg
94%
Copper
0.1mg
0.925mg
92%
Vitamin B1
0.059mg
1.1mg
87%
Vitamin B12
2.12µg
4.2µg
87%
Polyunsaturated fat
0.681g
9.332g
58%
Vitamin B2
0.171mg
0.9mg
56%
Vitamin B3
4.087mg
12mg
49%
Zinc
6.69mg
1.4mg
48%
Selenium
27.1µg
1µg
47%
Phosphorus
175mg
450mg
39%
Cholesterol
106mg
0mg
35%
Fiber
0g
6.1g
24%
Folate
9µg
102µg
23%
Vitamin E
0.51mg
3.45mg
20%
Saturated fat
7.305g
2.849g
20%
Sodium
48mg
490mg
19%
Protein
28.82g
23g
12%
Potassium
232mg
600mg
11%
Vitamin B5
0.568mg
11%
Monounsaturated fat
7.934g
4.376g
9%
Calcium
16mg
95mg
8%
Iron
2.43mg
2mg
5%
Choline
109.8mg
82mg
5%
Carbs
0g
9g
3%
Vitamin K
1.8µg
0µg
2%
Fats
18.42g
18g
1%
Magnesium
19mg
23mg
1%
Calories
289kcal
290kcal
0%
Protein per 100 calories
10g
7.9g
N/A
Calories per 10 g protein
100kcal
126kcal
N/A
Weight per 100 calories
35g
34g
N/A
Unsaturated / Saturated Fat ratio
1.2
4.8
N/A
Net carbs
0g
2.9g
N/A
Sugar
0g
0.8g
N/A
Manganese
0.01mg
0%
Tryptophan
0.181mg
0%
Threonine
1.101mg
0%
Isoleucine
1.253mg
0%
Leucine
2.192mg
0%
Lysine
2.328mg
0%
Methionine
0.717mg
0%
Phenylalanine
1.088mg
0%
Valine
1.367mg
0%
Histidine
0.879mg
0%
Macronutrient Comparison
Macronutrient breakdown side-by-side comparison
3
29%
18%
52%
Protein:
28.82 g
Fats:
18.42 g
Carbs:
0 g
Water:
52.48 g
Other:
0.28 g
2
23%
18%
9%
45%
5%
Protein:
23 g
Fats:
18 g
Carbs:
9 g
Water:
45 g
Other:
5 g
Contains
more
Protein Protein
+25.3%
Contains
more
Water Water
+16.6%
Contains
more
Carbs Carbs
+∞%
Contains
more
Other Other
+1685.7%
Fat Type Comparison
Fat type breakdown side-by-side comparison
1
46%
50%
4%
Saturated fat:
Sat. Fat
7.305 g
Monounsaturated fat:
Mono. Fat
7.934 g
Polyunsaturated fat:
Poly. Fat
0.681 g
2
17%
26%
56%
Saturated fat:
Sat. Fat
2.849 g
Monounsaturated fat:
Mono. Fat
4.376 g
Polyunsaturated fat:
Poly. Fat
9.332 g
Contains
more
Mono. Fat Monounsaturated fat
+81.3%
Contains
less
Sat. Fat Saturated fat
-61%
Contains
more
Poly. Fat Polyunsaturated fat
+1270.3%