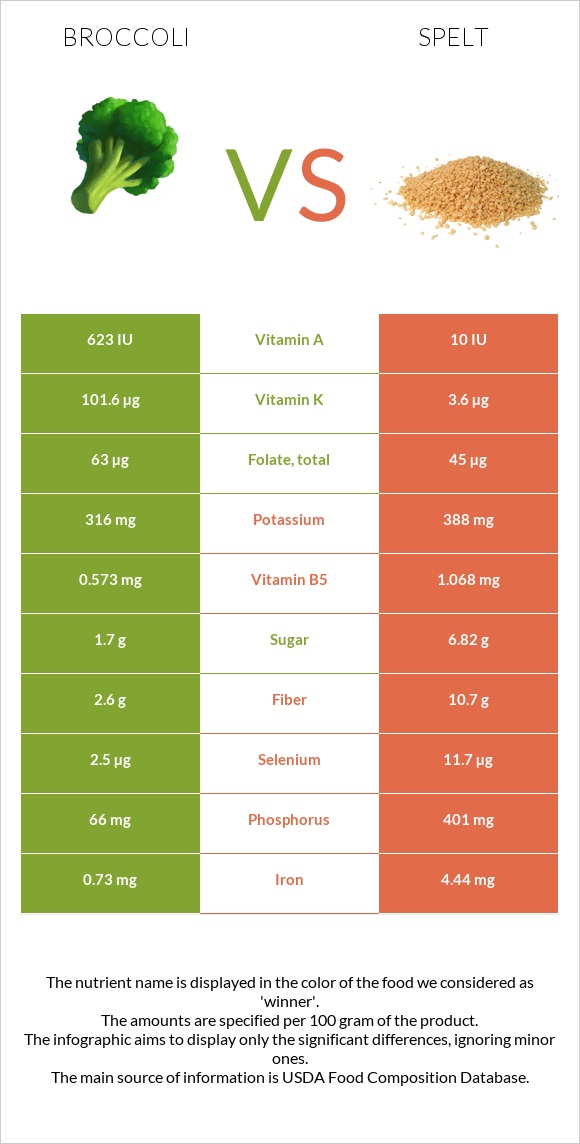
Significant differences between broccoli and spelt Broccoli is richer in vitamin C and vitamin K, while spelt is higher in manganese, copper, phosphorus, iron, vitamin B3, fiber, magnesium, and zinc. Spelt covers your daily manganese needs 121% more than broccoli. Spelt has a higher glycemic index (63) than broccoli (32). Specific food types used in this comparison are Broccoli, raw and Spelt, uncooked .
Infographic
Mineral Comparison
Mineral comparison score is based on the number of minerals by which one or the other food is richer. The "coverage" charts below show how much of the daily needs can be covered by 300 grams of the food.
1
100 g
300 g
1 spear (about 5" long) - 31g 0.5 cup, chopped or diced - 44g 1 cup chopped - 91g 1 NLEA serving - 148g 1 stalk - 151g 1 bunch - 608g
Magnesium
Magnesium
Calcium
Calcium
Potassium
Potassium
Iron
Iron
Copper
Copper
Zinc
Zinc
Phosphorus
Phosphorus
Sodium
Sodium
Manganese
Manganese
Selenium
Selenium
15%
14%
28%
27%
16%
11%
28%
4.3%
27%
14%
9
100 g
300 g
1 cup - 174g
Magnesium
Magnesium
Calcium
Calcium
Potassium
Potassium
Iron
Iron
Copper
Copper
Zinc
Zinc
Phosphorus
Phosphorus
Sodium
Sodium
Manganese
Manganese
Selenium
Selenium
97%
8.1%
34%
167%
170%
89%
172%
1%
389%
64%
Vitamin Comparison
Vitamin comparison score is based on the number of vitamins by which one or the other food is richer. The "coverage" charts below show how much of the daily needs can be covered by 300 grams of the food.
4
100 g
300 g
1 spear (about 5" long) - 31g 0.5 cup, chopped or diced - 44g 1 cup chopped - 91g 1 NLEA serving - 148g 1 stalk - 151g 1 bunch - 608g
Vitamin C
Vit. C
Vitamin D
Vit. D
Vitamin A
Vit. A
Vitamin E
Vit. E
Vitamin B1
Vit. B1
Vitamin B2
Vit. B2
Vitamin B3
Vit. B3
Vitamin B5
Vit. B5
Vitamin B6
Vit. B6
Vitamin B12
Vit. B12
Vitamin K
Vit. K
Folate
Folate
297%
0%
10%
16%
18%
27%
12%
34%
40%
0%
254%
47%
4
100 g
300 g
1 cup - 174g
Vitamin C
Vit. C
Vitamin D
Vit. D
Vitamin A
Vit. A
Vitamin E
Vit. E
Vitamin B1
Vit. B1
Vitamin B2
Vit. B2
Vitamin B3
Vit. B3
Vitamin B5
Vit. B5
Vitamin B6
Vit. B6
Vitamin B12
Vit. B12
Vitamin K
Vit. K
Folate
Folate
0%
0%
0%
16%
91%
26%
128%
64%
53%
0%
9%
34%
All nutrients comparison - raw data values
Nutrient
DV% diff.
Manganese
0.21mg
2.983mg
121%
Vitamin C
89.2mg
0mg
99%
Vitamin K
101.6µg
3.6µg
82%
Copper
0.049mg
0.511mg
51%
Phosphorus
66mg
401mg
48%
Iron
0.73mg
4.44mg
46%
Vitamin B3
0.639mg
6.843mg
39%
Fiber
2.6g
10.7g
32%
Magnesium
21mg
136mg
27%
Zinc
0.41mg
3.28mg
26%
Protein
2.82g
14.57g
24%
Vitamin B1
0.071mg
0.364mg
24%
Starch
0g
53.92g
22%
Carbs
6.64g
70.19g
21%
Selenium
2.5µg
11.7µg
17%
Calories
34kcal
338kcal
15%
Vitamin B5
0.573mg
1.068mg
10%
Polyunsaturated fat
0.038g
1.258g
8%
Folate
63µg
45µg
5%
Vitamin B6
0.175mg
0.23mg
4%
Fats
0.37g
2.43g
3%
Vitamin A
31µg
0µg
3%
Choline
18.7mg
3%
Calcium
47mg
27mg
2%
Potassium
316mg
388mg
2%
Saturated fat
0.039g
0.406g
2%
Sodium
33mg
8mg
1%
Monounsaturated fat
0.011g
0.445g
1%
Fructose
0.68g
0.24g
1%
Protein per 100 calories
8.3g
4.3g
N/A
Calories per 10 g protein
121kcal
232kcal
N/A
Weight per 100 calories
294g
30g
N/A
Unsaturated / Saturated Fat ratio
1.3
4.2
N/A
Net carbs
4.04g
59.49g
N/A
Sugar
1.7g
6.82g
N/A
Vitamin E
0.78mg
0.79mg
0%
Vitamin B2
0.117mg
0.113mg
0%
Tryptophan
0.033mg
0.132mg
0%
Threonine
0.088mg
0.443mg
0%
Isoleucine
0.079mg
0.552mg
0%
Leucine
0.129mg
1.07mg
0%
Lysine
0.135mg
0.409mg
0%
Methionine
0.038mg
0.258mg
0%
Phenylalanine
0.117mg
0.737mg
0%
Valine
0.125mg
0.681mg
0%
Histidine
0.059mg
0.36mg
0%
Omega-3 - ALA
0.065g
N/A
Macronutrient Comparison
Macronutrient breakdown side-by-side comparison
1
3%
7%
89%
Protein:
2.82 g
Fats:
0.37 g
Carbs:
6.64 g
Water:
89.3 g
Other:
0.87 g
4
15%
2%
70%
11%
2%
Protein:
14.57 g
Fats:
2.43 g
Carbs:
70.19 g
Water:
11.02 g
Other:
1.79 g
Contains
more
Water Water
+710.3%
Contains
more
Protein Protein
+416.7%
Contains
more
Fats Fats
+556.8%
Contains
more
Carbs Carbs
+957.1%
Contains
more
Other Other
+105.7%
Fat Type Comparison
Fat type breakdown side-by-side comparison
1
44%
13%
43%
Saturated fat:
Sat. Fat
0.039 g
Monounsaturated fat:
Mono. Fat
0.011 g
Polyunsaturated fat:
Poly. Fat
0.038 g
2
19%
21%
60%
Saturated fat:
Sat. Fat
0.406 g
Monounsaturated fat:
Mono. Fat
0.445 g
Polyunsaturated fat:
Poly. Fat
1.258 g
Contains
less
Sat. Fat Saturated fat
-90.4%
Contains
more
Mono. Fat Monounsaturated fat
+3945.5%
Contains
more
Poly. Fat Polyunsaturated fat
+3210.5%
Carbohydrate type comparison
Carbohydrate type breakdown side-by-side comparison
2
6%
29%
40%
12%
12%
Starch:
0 g
Sucrose:
0.1 g
Glucose:
0.49 g
Fructose:
0.68 g
Lactose:
0.21 g
Maltose:
0.21 g
Galactose:
0 g
4
89%
8%
Starch:
53.92 g
Sucrose:
0.59 g
Glucose:
0.84 g
Fructose:
0.24 g
Lactose:
0 g
Maltose:
5.15 g
Galactose:
0 g
Contains
more
Fructose Fructose
+183.3%
Contains
more
Lactose Lactose
+∞%
Contains
more
Starch Starch
+∞%
Contains
more
Sucrose Sucrose
+490%
Contains
more
Glucose Glucose
+71.4%
Contains
more
Maltose Maltose
+2352.4%