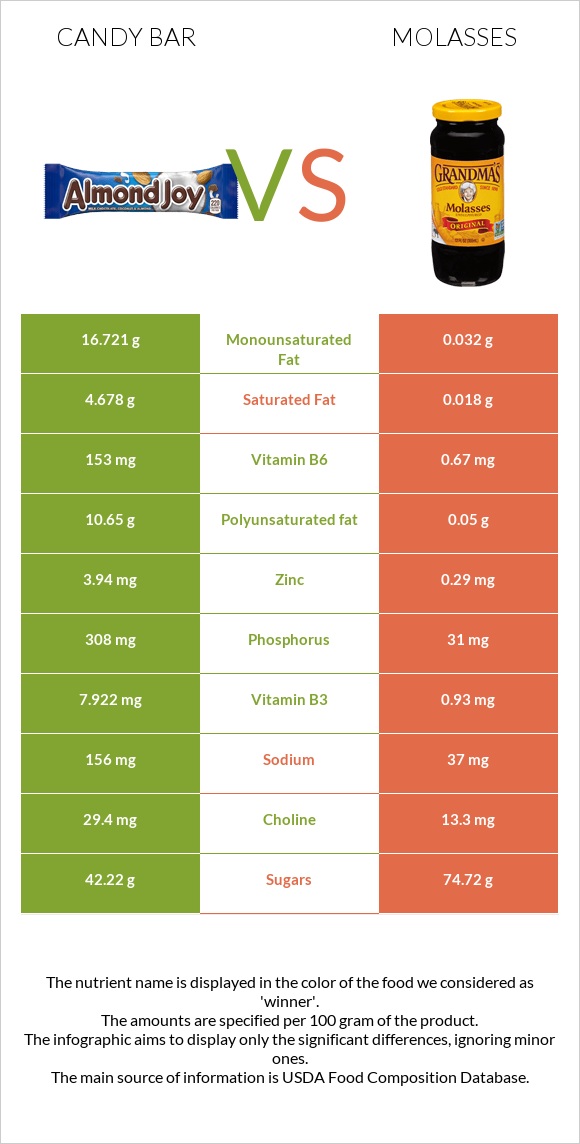
Differences between candy bar and molasses Candy bar has more vitamin B6, vitamin B3, phosphorus, zinc, copper, and vitamin E, while molasses have more iron, magnesium, potassium, and selenium. Candy bar's daily need coverage for vitamin B6 is 11718% higher. The food types used in this comparison are Candies, peanut bar and Molasses .
Infographic
Mineral Comparison
Mineral comparison score is based on the number of minerals by which one or the other food is richer. The "coverage" charts below show how much of the daily needs can be covered by 300 grams of the food.
3
100 g
300 g
1 oz - 28.35g 1 bar (1.4 oz) - 40g 1 bar (1.6 oz) - 45g 1 bar (1.75 fl oz) - 50g
Magnesium
Magnesium
Calcium
Calcium
Potassium
Potassium
Iron
Iron
Copper
Copper
Zinc
Zinc
Phosphorus
Phosphorus
Sodium
Sodium
Manganese
Manganese
Selenium
Selenium
79%
23%
36%
36%
258%
107%
132%
20%
162%
26%
7
100 g
300 g
1 serving 1 tbsp - 20g 1 cup - 337g
Magnesium
Magnesium
Calcium
Calcium
Potassium
Potassium
Iron
Iron
Copper
Copper
Zinc
Zinc
Phosphorus
Phosphorus
Sodium
Sodium
Manganese
Manganese
Selenium
Selenium
173%
62%
129%
177%
162%
7.9%
13%
4.8%
200%
97%
Vitamin Comparison
Vitamin comparison score is based on the number of vitamins by which one or the other food is richer. The "coverage" charts below show how much of the daily needs can be covered by 300 grams of the food.
6
100 g
300 g
1 oz - 28.35g 1 bar (1.4 oz) - 40g 1 bar (1.6 oz) - 45g 1 bar (1.75 fl oz) - 50g
Vitamin C
Vit. C
Vitamin D
Vit. D
Vitamin A
Vit. A
Vitamin E
Vit. E
Vitamin B1
Vit. B1
Vitamin B2
Vit. B2
Vitamin B3
Vit. B3
Vitamin B5
Vit. B5
Vitamin B6
Vit. B6
Vitamin B12
Vit. B12
Vitamin K
Vit. K
Folate
Folate
0%
0%
0%
82%
25%
32%
149%
50%
35308%
0%
0%
56%
0
100 g
300 g
1 serving 1 tbsp - 20g 1 cup - 337g
Vitamin C
Vit. C
Vitamin D
Vit. D
Vitamin A
Vit. A
Vitamin E
Vit. E
Vitamin B1
Vit. B1
Vitamin B2
Vit. B2
Vitamin B3
Vit. B3
Vitamin B5
Vit. B5
Vitamin B6
Vit. B6
Vitamin B12
Vit. B12
Vitamin K
Vit. K
Folate
Folate
0%
0%
0%
0%
10%
0.46%
17%
48%
155%
0%
0%
0%
All nutrients comparison - raw data values
Nutrient
DV% diff.
Vitamin B6
153mg
0.67mg
11718%
Polyunsaturated fat
10.65g
0.05g
71%
Fats
33.7g
0.1g
52%
Iron
0.97mg
4.72mg
47%
Vitamin B3
7.922mg
0.93mg
44%
Monounsaturated fat
16.721g
0.032g
42%
Phosphorus
308mg
31mg
40%
Zinc
3.94mg
0.29mg
33%
Copper
0.774mg
0.487mg
32%
Protein
15.5g
0g
31%
Magnesium
110mg
242mg
31%
Potassium
407mg
1464mg
31%
Vitamin E
4.1mg
0mg
27%
Selenium
4.7µg
17.8µg
24%
Saturated fat
4.678g
0.018g
21%
Folate
75µg
0µg
19%
Fiber
4.1g
0g
16%
Fructose
12.79g
16%
Calcium
78mg
205mg
13%
Calories
522kcal
290kcal
12%
Manganese
1.243mg
1.53mg
12%
Vitamin B2
0.14mg
0.002mg
11%
Carbs
47.4g
74.73g
9%
Sodium
156mg
37mg
5%
Vitamin B1
0.1mg
0.041mg
5%
Choline
29.4mg
13.3mg
3%
Vitamin B5
0.83mg
0.804mg
1%
Protein per 100 calories
3g
0g
N/A
Calories per 10 g protein
337kcal
N/A
Weight per 100 calories
19g
34g
N/A
Unsaturated / Saturated Fat ratio
5.9
4.6
N/A
Net carbs
43.3g
74.73g
N/A
Sugar
42.22g
74.72g
N/A
Tryptophan
0.149mg
0%
Threonine
0.52mg
0%
Isoleucine
0.534mg
0%
Leucine
0.986mg
0%
Lysine
0.545mg
0%
Methionine
0.185mg
0%
Phenylalanine
0.787mg
0%
Valine
0.638mg
0%
Histidine
0.385mg
0%
Macronutrient Comparison
Macronutrient breakdown side-by-side comparison
2
16%
34%
47%
2%
Protein:
15.5 g
Fats:
33.7 g
Carbs:
47.4 g
Water:
1.6 g
Other:
1.8 g
3
75%
22%
3%
Protein:
0 g
Fats:
0.1 g
Carbs:
74.73 g
Water:
21.87 g
Other:
3.3 g
Contains
more
Protein Protein
+∞%
Contains
more
Fats Fats
+33600%
Contains
more
Carbs Carbs
+57.7%
Contains
more
Water Water
+1266.9%
Contains
more
Other Other
+83.3%
Fat Type Comparison
Fat type breakdown side-by-side comparison
2
15%
52%
33%
Saturated fat:
Sat. Fat
4.678 g
Monounsaturated fat:
Mono. Fat
16.721 g
Polyunsaturated fat:
Poly. Fat
10.65 g
1
18%
32%
50%
Saturated fat:
Sat. Fat
0.018 g
Monounsaturated fat:
Mono. Fat
0.032 g
Polyunsaturated fat:
Poly. Fat
0.05 g
Contains
more
Mono. Fat Monounsaturated fat
+52153.1%
Contains
more
Poly. Fat Polyunsaturated fat
+21200%
Contains
less
Sat. Fat Saturated fat
-99.6%