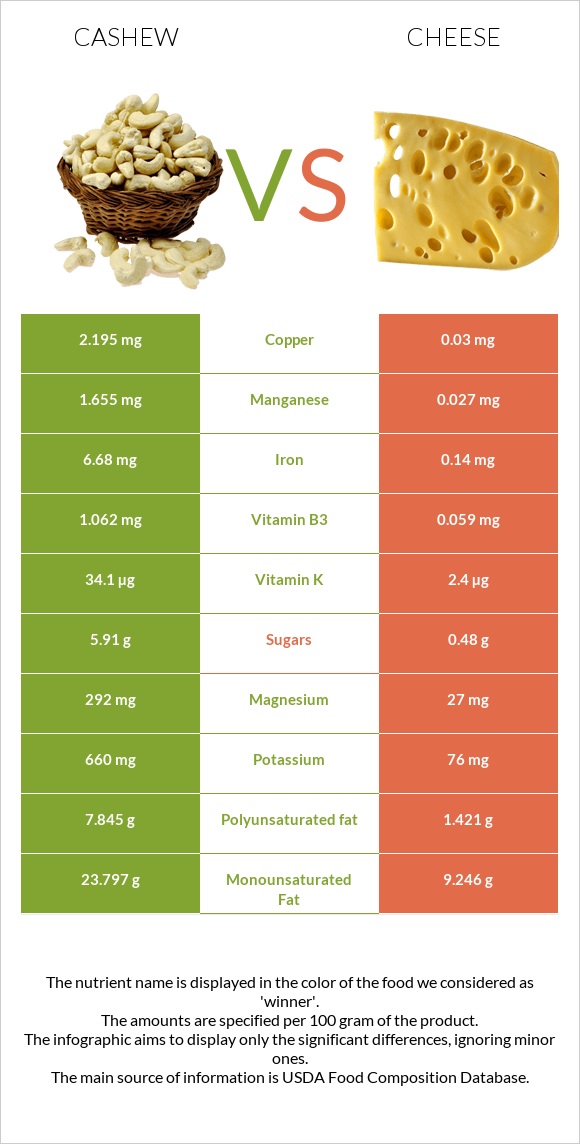
What are the main differences between cashew and cheese? Cashew is richer in copper, iron, manganese, magnesium, and vitamin B1, while cheese is higher in calcium, vitamin B12, and vitamin B2. Cashew's daily need coverage for copper is 241% higher. Cheese has 61 times less manganese than cashew. Cashew has 1.655mg of manganese, while cheese has 0.027mg. Cashew is lower in saturated fat. Cashew has a higher glycemic index (25) than cheese (0). We used Nuts, cashew nuts, raw and Cheese, cheddar types in this comparison.
Infographic
Mineral Comparison
Mineral comparison score is based on the number of minerals by which one or the other food is richer. The "coverage" charts below show how much of the daily needs can be covered by 300 grams of the food.
8
100 g
300 g
1 oz - 28.35g
Magnesium
Magnesium
Calcium
Calcium
Potassium
Potassium
Iron
Iron
Copper
Copper
Zinc
Zinc
Phosphorus
Phosphorus
Sodium
Sodium
Manganese
Manganese
Selenium
Selenium
209%
11%
58%
251%
732%
158%
254%
1.6%
216%
109%
2
100 g
300 g
1 cubic inch - 17g 1 slice (1 oz) - 28g 1 oz - 28.35g 1 cup, shredded - 113g 1 cup, diced - 132g 1 cup, melted - 244g
Magnesium
Magnesium
Calcium
Calcium
Potassium
Potassium
Iron
Iron
Copper
Copper
Zinc
Zinc
Phosphorus
Phosphorus
Sodium
Sodium
Manganese
Manganese
Selenium
Selenium
19%
213%
6.7%
5.3%
10%
99%
195%
85%
3.5%
155%
Vitamin Comparison
Vitamin comparison score is based on the number of vitamins by which one or the other food is richer. The "coverage" charts below show how much of the daily needs can be covered by 300 grams of the food.
7
100 g
300 g
1 oz - 28.35g
Vitamin C
Vit. C
Vitamin D
Vit. D
Vitamin A
Vit. A
Vitamin E
Vit. E
Vitamin B1
Vit. B1
Vitamin B2
Vit. B2
Vitamin B3
Vit. B3
Vitamin B5
Vit. B5
Vitamin B6
Vit. B6
Vitamin B12
Vit. B12
Vitamin K
Vit. K
Folate
Folate
1.7%
0%
0%
18%
106%
13%
20%
52%
96%
0%
85%
19%
4
100 g
300 g
1 cubic inch - 17g 1 slice (1 oz) - 28g 1 oz - 28.35g 1 cup, shredded - 113g 1 cup, diced - 132g 1 cup, melted - 244g
Vitamin C
Vit. C
Vitamin D
Vit. D
Vitamin A
Vit. A
Vitamin E
Vit. E
Vitamin B1
Vit. B1
Vitamin B2
Vit. B2
Vitamin B3
Vit. B3
Vitamin B5
Vit. B5
Vitamin B6
Vit. B6
Vitamin B12
Vit. B12
Vitamin K
Vit. K
Folate
Folate
0%
9%
110%
14%
7.3%
99%
1.1%
25%
15%
138%
6%
20%
All nutrients comparison - raw data values
Nutrient
DV% diff.
Copper
2.195mg
0.03mg
241%
Iron
6.68mg
0.14mg
82%
Manganese
1.655mg
0.027mg
71%
Calcium
37mg
710mg
67%
Magnesium
292mg
27mg
63%
Saturated fat
7.783g
18.867g
50%
Vitamin B12
0µg
1.1µg
46%
Polyunsaturated fat
7.845g
1.421g
43%
Vitamin A
0µg
330µg
37%
Monounsaturated fat
23.797g
9.246g
36%
Cholesterol
0mg
99mg
33%
Vitamin B1
0.423mg
0.029mg
33%
Sodium
12mg
653mg
28%
Vitamin B2
0.058mg
0.428mg
28%
Vitamin B6
0.417mg
0.066mg
27%
Vitamin K
34.1µg
2.4µg
26%
Phosphorus
593mg
455mg
20%
Zinc
5.78mg
3.64mg
19%
Potassium
660mg
76mg
17%
Fats
43.85g
33.31g
16%
Selenium
19.9µg
28.5µg
16%
Fiber
3.3g
0g
13%
Starch
23.49g
10%
Protein
18.22g
22.87g
9%
Carbs
30.19g
3.09g
9%
Vitamin B5
0.864mg
0.41mg
9%
Calories
553kcal
404kcal
7%
Vitamin B3
1.062mg
0.059mg
6%
Vitamin D*
0 IU
24 IU
3%
Vitamin D
0µg
0.6µg
3%
Choline
16.5mg
3%
Vitamin C
0.5mg
0mg
1%
Vitamin E
0.9mg
0.71mg
1%
Folate
25µg
27µg
1%
Protein per 100 calories
3.3g
5.7g
N/A
Calories per 10 g protein
304kcal
177kcal
N/A
Weight per 100 calories
18g
25g
N/A
Unsaturated / Saturated Fat ratio
4.1
0.57
N/A
Net carbs
26.89g
3.09g
N/A
Sugar
5.91g
0.48g
N/A
Trans fat
0.917g
N/A
Tryptophan
0.287mg
0.547mg
0%
Threonine
0.688mg
1.044mg
0%
Isoleucine
0.789mg
1.206mg
0%
Leucine
1.472mg
1.939mg
0%
Lysine
0.928mg
1.025mg
0%
Methionine
0.362mg
0.547mg
0%
Phenylalanine
0.951mg
1.074mg
0%
Valine
1.094mg
1.404mg
0%
Histidine
0.456mg
0.547mg
0%
Fructose
0.05g
0g
0%
Omega-3 - EPA
0g
0.01g
N/A
Omega-3 - DHA
0g
0.001g
N/A
Omega-3 - DPA
0g
0.017g
N/A
Omega-6 - Eicosadienoic acid
0g
0.007g
N/A
Macronutrient Comparison
Macronutrient breakdown side-by-side comparison
2
18%
44%
30%
5%
3%
Protein:
18.22 g
Fats:
43.85 g
Carbs:
30.19 g
Water:
5.2 g
Other:
2.54 g
3
23%
33%
3%
37%
4%
Protein:
22.87 g
Fats:
33.31 g
Carbs:
3.09 g
Water:
37.02 g
Other:
3.71 g
Contains
more
Fats Fats
+31.6%
Contains
more
Carbs Carbs
+877%
Contains
more
Protein Protein
+25.5%
Contains
more
Water Water
+611.9%
Contains
more
Other Other
+46.1%
Fat Type Comparison
Fat type breakdown side-by-side comparison
3
20%
60%
20%
Saturated fat:
Sat. Fat
7.783 g
Monounsaturated fat:
Mono. Fat
23.797 g
Polyunsaturated fat:
Poly. Fat
7.845 g
0
64%
31%
5%
Saturated fat:
Sat. Fat
18.867 g
Monounsaturated fat:
Mono. Fat
9.246 g
Polyunsaturated fat:
Poly. Fat
1.421 g
Contains
less
Sat. Fat Saturated fat
-58.7%
Contains
more
Mono. Fat Monounsaturated fat
+157.4%
Contains
more
Poly. Fat Polyunsaturated fat
+452.1%
Carbohydrate type comparison
Carbohydrate type breakdown side-by-side comparison
3
80%
20%
Starch:
23.49 g
Sucrose:
5.81 g
Glucose:
0.05 g
Fructose:
0.05 g
Lactose:
0 g
Maltose:
0 g
Galactose:
0 g
3
54%
25%
21%
Starch:
0 g
Sucrose:
0 g
Glucose:
0.26 g
Fructose:
0 g
Lactose:
0.12 g
Maltose:
0 g
Galactose:
0.1 g
Contains
more
Starch Starch
+∞%
Contains
more
Sucrose Sucrose
+∞%
Contains
more
Fructose Fructose
+∞%
Contains
more
Glucose Glucose
+420%
Contains
more
Lactose Lactose
+∞%
Contains
more
Galactose Galactose
+∞%