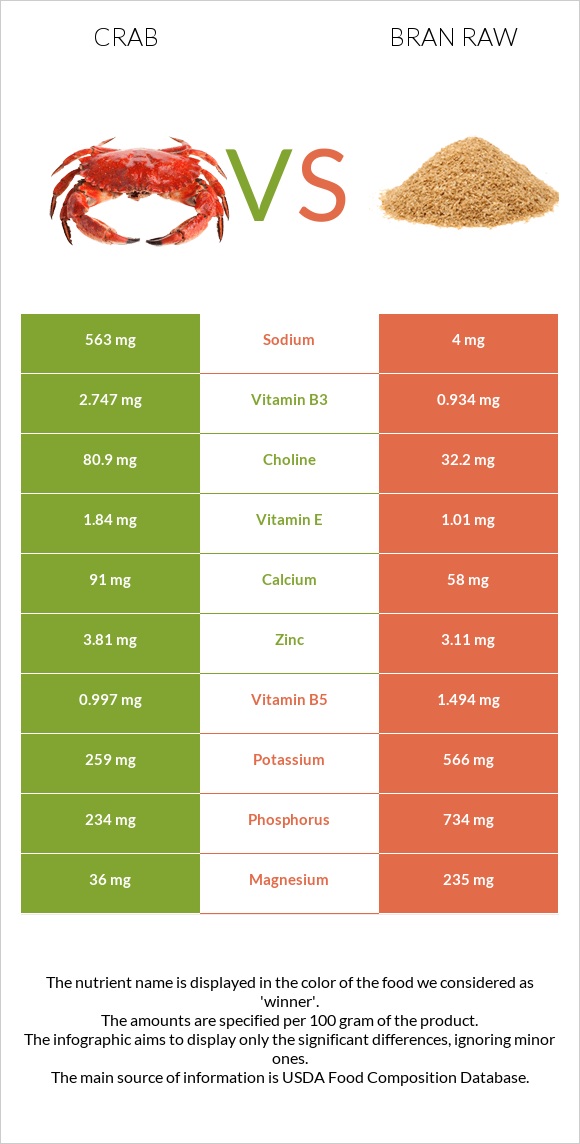
The main differences between crab and bran raw Crab has more vitamin B12 and copper; however, bran raw has more manganese, vitamin B1, phosphorus, fiber, iron, and magnesium. Daily need coverage for manganese for bran raw is 242% higher. Bran raw is lower in cholesterol. Bran raw has a higher glycemic index than crab. Food types used in this article are Crustaceans, crab, blue, canned and Oat bran, raw .
Infographic
Mineral Comparison
Mineral comparison score is based on the number of minerals by which one or the other food is richer. The "coverage" charts below show how much of the daily needs can be covered by 300 grams of the food.
3
100 g
300 g
1 oz - 28.35g 3 oz - 85g 1 can (6.5 oz), drained - 125g 1 cup - 135g
Magnesium
Magnesium
Calcium
Calcium
Potassium
Potassium
Iron
Iron
Copper
Copper
Zinc
Zinc
Phosphorus
Phosphorus
Sodium
Sodium
Manganese
Manganese
Selenium
Selenium
26%
27%
23%
19%
271%
104%
100%
73%
9.7%
234%
6
100 g
300 g
1 cup - 94g
Magnesium
Magnesium
Calcium
Calcium
Potassium
Potassium
Iron
Iron
Copper
Copper
Zinc
Zinc
Phosphorus
Phosphorus
Sodium
Sodium
Manganese
Manganese
Selenium
Selenium
168%
17%
50%
203%
134%
85%
315%
0.52%
734%
247%
Vitamin Comparison
Vitamin comparison score is based on the number of vitamins by which one or the other food is richer. The "coverage" charts below show how much of the daily needs can be covered by 300 grams of the food.
5
100 g
300 g
1 oz - 28.35g 3 oz - 85g 1 can (6.5 oz), drained - 125g 1 cup - 135g
Vitamin C
Vit. C
Vitamin D
Vit. D
Vitamin A
Vit. A
Vitamin E
Vit. E
Vitamin B1
Vit. B1
Vitamin B2
Vit. B2
Vitamin B3
Vit. B3
Vitamin B5
Vit. B5
Vitamin B6
Vit. B6
Vitamin B12
Vit. B12
Vitamin K
Vit. K
Folate
Folate
11%
0%
0.33%
37%
5.8%
21%
52%
60%
36%
416%
0.75%
38%
4
100 g
300 g
1 cup - 94g
Vitamin C
Vit. C
Vitamin D
Vit. D
Vitamin A
Vit. A
Vitamin E
Vit. E
Vitamin B1
Vit. B1
Vitamin B2
Vit. B2
Vitamin B3
Vit. B3
Vitamin B5
Vit. B5
Vitamin B6
Vit. B6
Vitamin B12
Vit. B12
Vitamin K
Vit. K
Folate
Folate
0%
0%
0%
20%
293%
51%
18%
90%
38%
0%
8%
39%
All nutrients comparison - raw data values
Nutrient
DV% diff.
Manganese
0.074mg
5.63mg
242%
Vitamin B12
3.33µg
0µg
139%
Vitamin B1
0.023mg
1.17mg
96%
Phosphorus
234mg
734mg
71%
Fiber
0g
15.4g
62%
Iron
0.5mg
5.41mg
61%
Magnesium
36mg
235mg
47%
Copper
0.814mg
0.403mg
46%
Cholesterol
97mg
0mg
32%
Sodium
563mg
4mg
24%
Carbs
0g
66.22g
22%
Polyunsaturated fat
0.258g
2.766g
17%
Vitamin B3
2.747mg
0.934mg
11%
Fats
0.74g
7.03g
10%
Vitamin B2
0.093mg
0.22mg
10%
Vitamin B5
0.997mg
1.494mg
10%
Potassium
259mg
566mg
9%
Choline
80.9mg
32.2mg
9%
Calories
83kcal
246kcal
8%
Zinc
3.81mg
3.11mg
6%
Vitamin E
1.84mg
1.01mg
6%
Monounsaturated fat
0.129g
2.376g
6%
Saturated fat
0.201g
1.328g
5%
Vitamin C
3.3mg
0mg
4%
Selenium
42.9µg
45.2µg
4%
Calcium
91mg
58mg
3%
Vitamin K
0.3µg
3.2µg
2%
Protein
17.88g
17.3g
1%
Vitamin B6
0.156mg
0.165mg
1%
Protein per 100 calories
22g
7g
N/A
Calories per 10 g protein
46kcal
142kcal
N/A
Weight per 100 calories
120g
41g
N/A
Unsaturated / Saturated Fat ratio
1.9
3.9
N/A
Net carbs
0g
50.82g
N/A
Sugar
0g
1.45g
N/A
Vitamin A
1µg
0µg
0%
Folate
51µg
52µg
0%
Trans fat
0.014g
N/A
Tryptophan
0.226mg
0.335mg
0%
Threonine
0.727mg
0.502mg
0%
Isoleucine
0.776mg
0.668mg
0%
Leucine
1.307mg
1.374mg
0%
Lysine
1.386mg
0.76mg
0%
Methionine
0.452mg
0.335mg
0%
Phenylalanine
0.708mg
0.908mg
0%
Valine
0.806mg
0.964mg
0%
Histidine
0.393mg
0.41mg
0%
Omega-3 - EPA
0.101g
0g
N/A
Omega-3 - DHA
0.067g
0g
N/A
Omega-3 - DPA
0.009g
0g
N/A
Omega-6 - Eicosadienoic acid
0.005g
N/A
Macronutrient Comparison
Macronutrient breakdown side-by-side comparison
2
18%
80%
2%
Protein:
17.88 g
Fats:
0.74 g
Carbs:
0 g
Water:
79.69 g
Other:
1.69 g
3
17%
7%
66%
7%
3%
Protein:
17.3 g
Fats:
7.03 g
Carbs:
66.22 g
Water:
6.55 g
Other:
2.9 g
Contains
more
Water Water
+1116.6%
Contains
more
Fats Fats
+850%
Contains
more
Carbs Carbs
+∞%
Contains
more
Other Other
+71.6%
Fat Type Comparison
Fat type breakdown side-by-side comparison
1
34%
22%
44%
Saturated fat:
Sat. Fat
0.201 g
Monounsaturated fat:
Mono. Fat
0.129 g
Polyunsaturated fat:
Poly. Fat
0.258 g
2
21%
37%
43%
Saturated fat:
Sat. Fat
1.328 g
Monounsaturated fat:
Mono. Fat
2.376 g
Polyunsaturated fat:
Poly. Fat
2.766 g
Contains
less
Sat. Fat Saturated fat
-84.9%
Contains
more
Mono. Fat Monounsaturated fat
+1741.9%
Contains
more
Poly. Fat Polyunsaturated fat
+972.1%