
Ice creams, BREYERS, No Sugar Added, Vanilla Chocolate Strawberry vs. Mars — In-Depth Nutrition Comparison
Compare
What are the main differences between ice creams, BREYERS, No Sugar Added, Vanilla Chocolate Strawberry and mars?
- Ice creams, BREYERS, No Sugar Added, Vanilla Chocolate Strawberry has less fats, carbs, iron, and fiber than mars.
- Mars's daily need coverage for saturated fat is 39% higher.
- Ice creams, BREYERS, No Sugar Added, Vanilla Chocolate Strawberry contains less saturated fat.
We used Ice creams, BREYERS, No Sugar Added, Vanilla Chocolate Strawberry and Candies, MARS SNACKFOOD US, M&M's Crispy Chocolate Candies types in this comparison.
Infographic
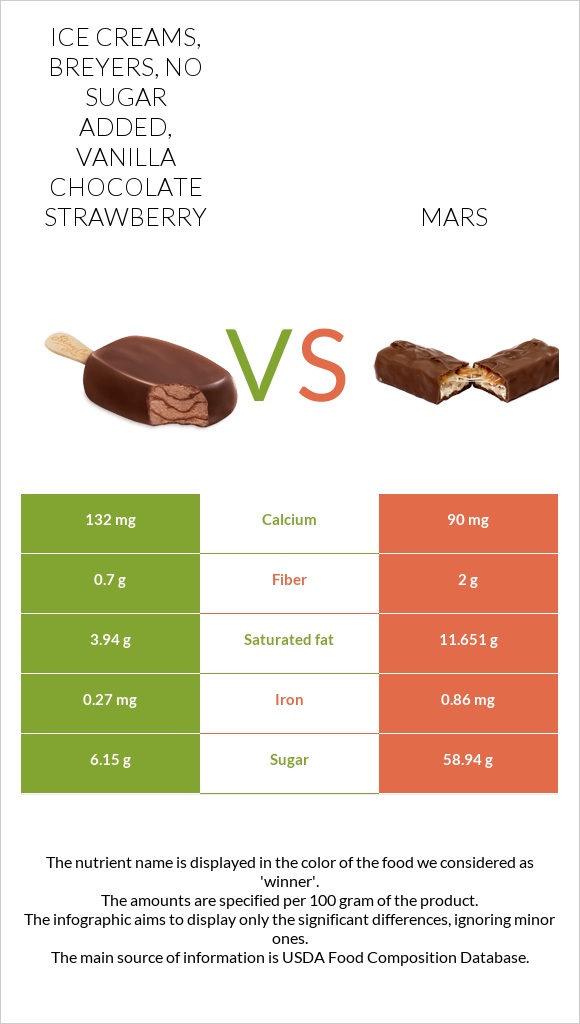
Infographic link
Mineral Comparison
The mineral comparison score is based on which food has a more favorable amount of each mineral. The �coverage� charts below show how much of the daily mineral needs are covered by the selected amount of each food.
| Contains more CalciumCalcium | +46.7% |
| Contains less SodiumSodium | -50% |
| Contains more IronIron | +218.5% |
Vitamin Comparison
The vitamin comparison score is based on the number of vitamins in which one food is richer than the other. The �coverage� charts below show how much of the daily vitamin needs are covered by the selected amount of each food.
| Contains more Vitamin CVitamin C | +60% |
All nutrients comparison - raw data values
| Nutrient |  |
 |
DV% diff. |
| Saturated fat | 3.94g | 11.651g | 35% |
| Fats | 6.26g | 19.32g | 20% |
| Calories | 143kcal | 475kcal | 17% |
| Carbs | 21.7g | 72.4g | 17% |
| Iron | 0.27mg | 0.86mg | 7% |
| Fiber | 0.7g | 2g | 5% |
| Calcium | 132mg | 90mg | 4% |
| Sodium | 68mg | 136mg | 3% |
| Cholesterol | 18mg | 12mg | 2% |
| Protein | 3.71g | 4.28g | 1% |
| Protein per 100 calories | 2.6g | 0.9g | N/A |
| Calories per 10 g protein | 385kcal | 1110kcal | N/A |
| Weight per 100 calories | 70g | 21g | N/A |
| Vitamin C | 0.8mg | 0.5mg | 0% |
| Net carbs | 21g | 70.4g | N/A |
| Sugar | 6.15g | 58.94g | N/A |
| Trans fat | 0.131g | N/A |
Macronutrient Comparison
Macronutrient breakdown side-by-side comparison
Protein:
3.71 g
Fats:
6.26 g
Carbs:
21.7 g
Water:
67.34 g
Other:
0.99 g
Protein:
4.28 g
Fats:
19.32 g
Carbs:
72.4 g
Water:
1.7 g
Other:
2.3 g
| Contains more WaterWater | +3861.2% |
| Contains more ProteinProtein | +15.4% |
| Contains more FatsFats | +208.6% |
| Contains more CarbsCarbs | +233.6% |
Fat Type Comparison
Fat type breakdown side-by-side comparison
Saturated fat:
Sat. Fat
3.94 g
Monounsaturated fat:
Mono. Fat
0 g
Polyunsaturated fat:
Poly. Fat
0 g
Saturated fat:
Sat. Fat
11.651 g
Monounsaturated fat:
Mono. Fat
0 g
Polyunsaturated fat:
Poly. Fat
0 g
| Contains less Sat. FatSaturated fat | -66.2% |
~equal in
Monounsaturated fat
~g
~equal in
Polyunsaturated fat
~g