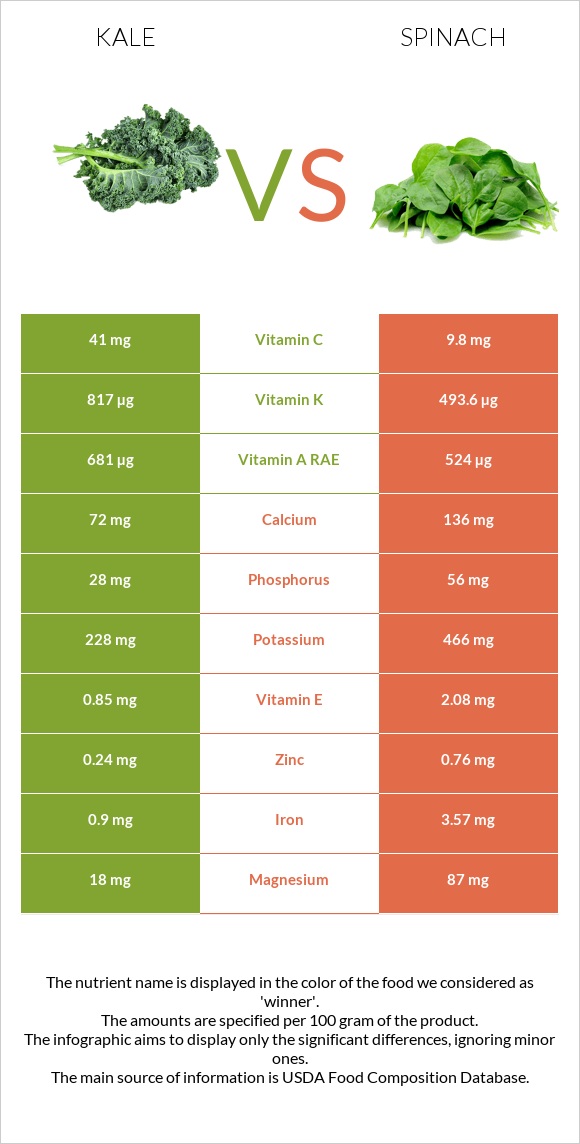
Important differences between kale and spinach Kale has more vitamin K, vitamin A, and vitamin C; however, spinach has more iron, folate, manganese, magnesium, vitamin B2, vitamin E, and vitamin B6. Kale's daily need coverage for vitamin K is 270% more. Kale has 4 times more vitamin C than spinach. Kale has 41mg of vitamin C, while spinach has 9.8mg. The food varieties used in the comparison are Kale, cooked, boiled, drained, without salt and Spinach, cooked, boiled, drained, without salt .
Infographic
Mineral Comparison
Mineral comparison score is based on the number of minerals by which one or the other food is richer. The "coverage" charts below show how much of the daily needs can be covered by 300 grams of the food.
1
100 g
300 g
1 cup, chopped - 130g
Magnesium
Magnesium
Calcium
Calcium
Potassium
Potassium
Iron
Iron
Copper
Copper
Zinc
Zinc
Phosphorus
Phosphorus
Sodium
Sodium
Manganese
Manganese
Selenium
Selenium
13%
22%
20%
34%
52%
6.5%
12%
3%
54%
4.9%
9
100 g
300 g
1 cup - 180g
Magnesium
Magnesium
Calcium
Calcium
Potassium
Potassium
Iron
Iron
Copper
Copper
Zinc
Zinc
Phosphorus
Phosphorus
Sodium
Sodium
Manganese
Manganese
Selenium
Selenium
62%
41%
41%
134%
58%
21%
24%
9.1%
122%
8.2%
Vitamin Comparison
Vitamin comparison score is based on the number of vitamins by which one or the other food is richer. The "coverage" charts below show how much of the daily needs can be covered by 300 grams of the food.
3
100 g
300 g
1 cup, chopped - 130g
Vitamin C
Vit. C
Vitamin D
Vit. D
Vitamin A
Vit. A
Vitamin E
Vit. E
Vitamin B1
Vit. B1
Vitamin B2
Vit. B2
Vitamin B3
Vit. B3
Vitamin B5
Vit. B5
Vitamin B6
Vit. B6
Vitamin B12
Vit. B12
Vitamin K
Vit. K
Folate
Folate
137%
0%
227%
17%
13%
16%
9.4%
2.9%
32%
0%
2043%
9.8%
6
100 g
300 g
1 cup - 180g
Vitamin C
Vit. C
Vitamin D
Vit. D
Vitamin A
Vit. A
Vitamin E
Vit. E
Vitamin B1
Vit. B1
Vitamin B2
Vit. B2
Vitamin B3
Vit. B3
Vitamin B5
Vit. B5
Vitamin B6
Vit. B6
Vitamin B12
Vit. B12
Vitamin K
Vit. K
Folate
Folate
33%
0%
175%
42%
24%
54%
9.2%
8.7%
56%
0%
1234%
110%
All nutrients comparison - raw data values
Nutrient
DV% diff.
Vitamin K
817µg
493.6µg
270%
Vitamin C
41mg
9.8mg
35%
Iron
0.9mg
3.57mg
33%
Folate
13µg
146µg
33%
Manganese
0.416mg
0.935mg
23%
Vitamin A
681µg
524µg
17%
Magnesium
18mg
87mg
16%
Vitamin B2
0.07mg
0.236mg
13%
Vitamin E
0.85mg
2.08mg
8%
Vitamin B6
0.138mg
0.242mg
8%
Potassium
228mg
466mg
7%
Calcium
72mg
136mg
6%
Zinc
0.24mg
0.76mg
5%
Phosphorus
28mg
56mg
4%
Vitamin B1
0.053mg
0.095mg
4%
Choline
0.4mg
19.7mg
4%
Protein
1.9g
2.97g
2%
Fiber
2g
2.4g
2%
Copper
0.156mg
0.174mg
2%
Sodium
23mg
70mg
2%
Vitamin B5
0.049mg
0.145mg
2%
Carbs
5.63g
3.75g
1%
Selenium
0.9µg
1.5µg
1%
Polyunsaturated fat
0.193g
0.109g
1%
Calories
28kcal
23kcal
0%
Protein per 100 calories
6.8g
13g
N/A
Calories per 10 g protein
147kcal
77kcal
N/A
Weight per 100 calories
357g
435g
N/A
Fats
0.4g
0.26g
0%
Net carbs
3.63g
1.35g
N/A
Sugar
1.25g
0.43g
N/A
Vitamin B3
0.5mg
0.49mg
0%
Saturated fat
0.052g
0.043g
0%
Monounsaturated fat
0.03g
0.006g
0%
Tryptophan
0.023mg
0.04mg
0%
Threonine
0.085mg
0.127mg
0%
Isoleucine
0.114mg
0.152mg
0%
Leucine
0.133mg
0.231mg
0%
Lysine
0.114mg
0.182mg
0%
Methionine
0.018mg
0.055mg
0%
Phenylalanine
0.097mg
0.134mg
0%
Valine
0.104mg
0.168mg
0%
Histidine
0.04mg
0.066mg
0%
Macronutrient Comparison
Macronutrient breakdown side-by-side comparison
2
2%
6%
91%
Protein:
1.9 g
Fats:
0.4 g
Carbs:
5.63 g
Water:
91.2 g
Other:
0.87 g
3
3%
4%
91%
2%
Protein:
2.97 g
Fats:
0.26 g
Carbs:
3.75 g
Water:
91.21 g
Other:
1.81 g
Contains
more
Fats Fats
+53.8%
Contains
more
Carbs Carbs
+50.1%
Contains
more
Protein Protein
+56.3%
Contains
more
Other Other
+108%
Fat Type Comparison
Fat type breakdown side-by-side comparison
2
19%
11%
70%
Saturated fat:
Sat. Fat
0.052 g
Monounsaturated fat:
Mono. Fat
0.03 g
Polyunsaturated fat:
Poly. Fat
0.193 g
1
27%
4%
69%
Saturated fat:
Sat. Fat
0.043 g
Monounsaturated fat:
Mono. Fat
0.006 g
Polyunsaturated fat:
Poly. Fat
0.109 g
Contains
more
Mono. Fat Monounsaturated fat
+400%
Contains
more
Poly. Fat Polyunsaturated fat
+77.1%
Contains
less
Sat. Fat Saturated fat
-17.3%