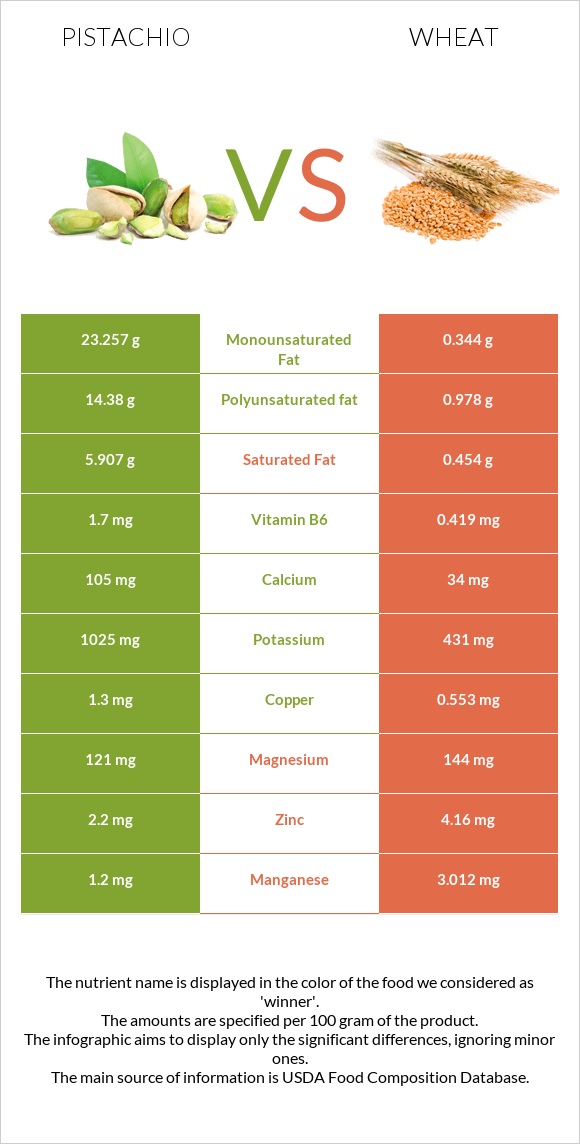
What are the differences between pistachios and wheat ? Pistachios are higher in vitamin B6, copper, vitamin B1, potassium, and vitamin A, yet wheat is higher in selenium, manganese, vitamin B3, and zinc. Wheat 's daily need coverage for selenium is 150% more. The amount of saturated fat in wheat is lower. The glycemic index of pistachios is lower. We used Nuts, pistachio nuts, raw and Wheat, durum types in this article.
Infographic
Mineral Comparison
Mineral comparison score is based on the number of minerals by which one or the other food is richer. The "coverage" charts below show how much of the daily needs can be covered by 300 grams of the food.
5
100 g
300 g
1 kernel - 0.7g 1 oz (49 kernels) - 28.35g 1 cup - 123g
Magnesium
Magnesium
Calcium
Calcium
Potassium
Potassium
Iron
Iron
Copper
Copper
Zinc
Zinc
Phosphorus
Phosphorus
Sodium
Sodium
Manganese
Manganese
Selenium
Selenium
86%
32%
90%
147%
433%
60%
210%
0.13%
157%
38%
4
100 g
300 g
1 cup - 192g
Magnesium
Magnesium
Calcium
Calcium
Potassium
Potassium
Iron
Iron
Copper
Copper
Zinc
Zinc
Phosphorus
Phosphorus
Sodium
Sodium
Manganese
Manganese
Selenium
Selenium
103%
10%
38%
132%
184%
113%
218%
0.26%
393%
488%
Vitamin Comparison
Vitamin comparison score is based on the number of vitamins by which one or the other food is richer. The "coverage" charts below show how much of the daily needs can be covered by 300 grams of the food.
7
100 g
300 g
1 kernel - 0.7g 1 oz (49 kernels) - 28.35g 1 cup - 123g
Vitamin C
Vit. C
Vitamin D
Vit. D
Vitamin A
Vit. A
Vitamin E
Vit. E
Vitamin B1
Vit. B1
Vitamin B2
Vit. B2
Vitamin B3
Vit. B3
Vitamin B5
Vit. B5
Vitamin B6
Vit. B6
Vitamin B12
Vit. B12
Vitamin K
Vit. K
Folate
Folate
19%
0%
8.7%
57%
218%
37%
24%
31%
392%
0%
0%
38%
2
100 g
300 g
1 cup - 192g
Vitamin C
Vit. C
Vitamin D
Vit. D
Vitamin A
Vit. A
Vitamin E
Vit. E
Vitamin B1
Vit. B1
Vitamin B2
Vit. B2
Vitamin B3
Vit. B3
Vitamin B5
Vit. B5
Vitamin B6
Vit. B6
Vitamin B12
Vit. B12
Vitamin K
Vit. K
Folate
Folate
0%
0%
0%
0%
105%
28%
126%
56%
97%
0%
0%
32%
All nutrients comparison - raw data values
Nutrient
DV% diff.
Selenium
7µg
89.4µg
150%
Vitamin B6
1.7mg
0.419mg
99%
Polyunsaturated fat
14.38g
0.978g
89%
Copper
1.3mg
0.553mg
83%
Manganese
1.2mg
3.012mg
79%
Fats
45.32g
2.47g
66%
Monounsaturated fat
23.257g
0.344g
57%
Fiber
10.6g
42%
Vitamin B1
0.87mg
0.419mg
38%
Vitamin B3
1.3mg
6.738mg
34%
Saturated fat
5.907g
0.454g
25%
Vitamin E
2.86mg
19%
Zinc
2.2mg
4.16mg
18%
Potassium
1025mg
431mg
17%
Carbs
27.17g
71.13g
15%
Protein
20.16g
13.68g
13%
Calories
560kcal
339kcal
11%
Vitamin B5
0.52mg
0.935mg
8%
Calcium
105mg
34mg
7%
Vitamin C
5.6mg
0mg
6%
Magnesium
121mg
144mg
5%
Iron
3.92mg
3.52mg
5%
Phosphorus
490mg
508mg
3%
Vitamin A
26µg
0µg
3%
Vitamin B2
0.16mg
0.121mg
3%
Folate
51µg
43µg
2%
Starch
1.67g
1%
Protein per 100 calories
3.6g
4g
N/A
Calories per 10 g protein
278kcal
248kcal
N/A
Weight per 100 calories
18g
29g
N/A
Unsaturated / Saturated Fat ratio
6.4
2.9
N/A
Net carbs
16.57g
71.13g
N/A
Sugar
7.66g
N/A
Sodium
1mg
2mg
0%
Tryptophan
0.251mg
0.176mg
0%
Threonine
0.684mg
0.366mg
0%
Isoleucine
0.917mg
0.533mg
0%
Leucine
1.604mg
0.934mg
0%
Lysine
1.138mg
0.303mg
0%
Methionine
0.36mg
0.221mg
0%
Phenylalanine
1.092mg
0.681mg
0%
Valine
1.249mg
0.594mg
0%
Histidine
0.512mg
0.322mg
0%
Fructose
0.24g
0%
Omega-6 - Linoleic acid
14.091g
N/A
Macronutrient Comparison
Macronutrient breakdown side-by-side comparison
3
20%
45%
27%
4%
3%
Protein:
20.16 g
Fats:
45.32 g
Carbs:
27.17 g
Water:
4.37 g
Other:
2.98 g
2
14%
2%
71%
11%
2%
Protein:
13.68 g
Fats:
2.47 g
Carbs:
71.13 g
Water:
10.94 g
Other:
1.78 g
Contains
more
Protein Protein
+47.4%
Contains
more
Fats Fats
+1734.8%
Contains
more
Other Other
+67.4%
Contains
more
Carbs Carbs
+161.8%
Contains
more
Water Water
+150.3%
Fat Type Comparison
Fat type breakdown side-by-side comparison
2
14%
53%
33%
Saturated fat:
Sat. Fat
5.907 g
Monounsaturated fat:
Mono. Fat
23.257 g
Polyunsaturated fat:
Poly. Fat
14.38 g
1
26%
19%
55%
Saturated fat:
Sat. Fat
0.454 g
Monounsaturated fat:
Mono. Fat
0.344 g
Polyunsaturated fat:
Poly. Fat
0.978 g
Contains
more
Mono. Fat Monounsaturated fat
+6660.8%
Contains
more
Poly. Fat Polyunsaturated fat
+1370.3%
Contains
less
Sat. Fat Saturated fat
-92.3%