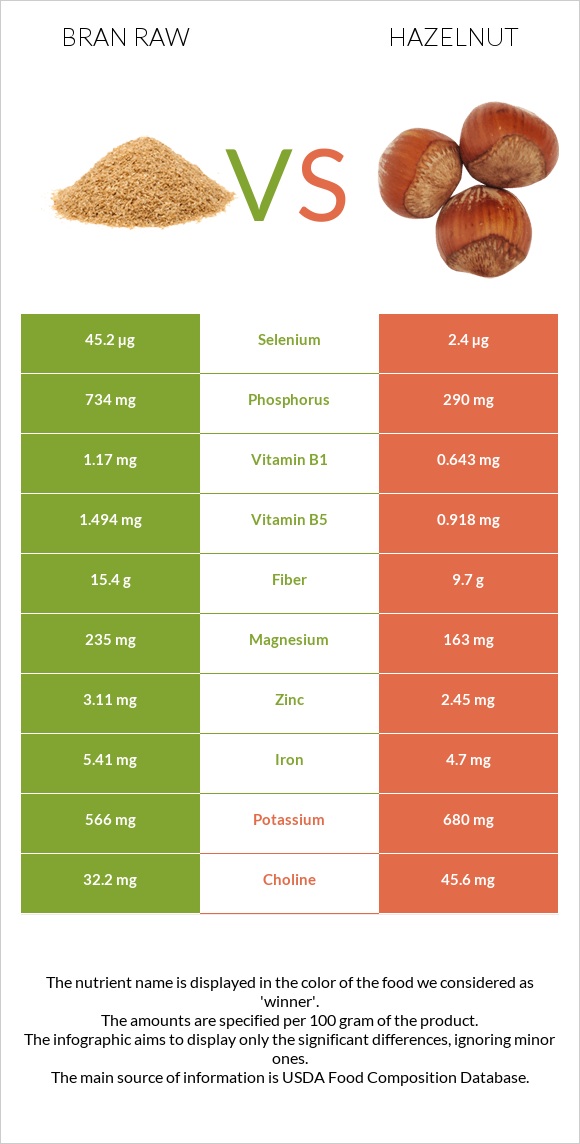
Summary of differences between bran raw and hazelnut Bran raw has more selenium, phosphorus, vitamin B1, fiber, and magnesium, while hazelnut has more copper, vitamin E, vitamin B6, and manganese. Hazelnut covers your daily need for copper, 147% more than bran raw. Bran raw contains 19 times more selenium than hazelnut. While bran raw contains 45.2µg of selenium, hazelnut contains only 2.4µg. The amount of saturated fat in bran raw is lower. Hazelnut has a lower glycemic index. The glycemic index of hazelnut is 15, while the glycemic index of bran raw is 56. These are the specific foods used in this comparison Oat bran, raw and Nuts, hazelnuts or filberts .
Infographic
Mineral Comparison
Mineral comparison score is based on the number of minerals by which one or the other food is richer. The "coverage" charts below show how much of the daily needs can be covered by 300 grams of the food.
5
100 g
300 g
1 cup - 94g
Magnesium
Magnesium
Calcium
Calcium
Potassium
Potassium
Iron
Iron
Copper
Copper
Zinc
Zinc
Phosphorus
Phosphorus
Sodium
Sodium
Manganese
Manganese
Selenium
Selenium
168%
17%
50%
203%
134%
85%
315%
0.52%
734%
247%
4
100 g
300 g
10 nuts - 14g 1 oz (21 whole kernels) - 28.35g 1 cup, ground - 75g 1 cup, chopped - 115g 1 cup, whole - 135g
Magnesium
Magnesium
Calcium
Calcium
Potassium
Potassium
Iron
Iron
Copper
Copper
Zinc
Zinc
Phosphorus
Phosphorus
Sodium
Sodium
Manganese
Manganese
Selenium
Selenium
116%
34%
60%
176%
575%
67%
124%
0%
805%
13%
Vitamin Comparison
Vitamin comparison score is based on the number of vitamins by which one or the other food is richer. The "coverage" charts below show how much of the daily needs can be covered by 300 grams of the food.
3
100 g
300 g
1 cup - 94g
Vitamin C
Vit. C
Vitamin D
Vit. D
Vitamin A
Vit. A
Vitamin E
Vit. E
Vitamin B1
Vit. B1
Vitamin B2
Vit. B2
Vitamin B3
Vit. B3
Vitamin B5
Vit. B5
Vitamin B6
Vit. B6
Vitamin B12
Vit. B12
Vitamin K
Vit. K
Folate
Folate
0%
0%
0%
20%
293%
51%
18%
90%
38%
0%
8%
39%
7
100 g
300 g
10 nuts - 14g 1 oz (21 whole kernels) - 28.35g 1 cup, ground - 75g 1 cup, chopped - 115g 1 cup, whole - 135g
Vitamin C
Vit. C
Vitamin D
Vit. D
Vitamin A
Vit. A
Vitamin E
Vit. E
Vitamin B1
Vit. B1
Vitamin B2
Vit. B2
Vitamin B3
Vit. B3
Vitamin B5
Vit. B5
Vitamin B6
Vit. B6
Vitamin B12
Vit. B12
Vitamin K
Vit. K
Folate
Folate
21%
0%
0.33%
301%
161%
26%
34%
55%
130%
0%
36%
85%
All nutrients comparison - raw data values
Nutrient
DV% diff.
Copper
0.403mg
1.725mg
147%
Monounsaturated fat
2.376g
45.652g
108%
Vitamin E
1.01mg
15.03mg
93%
Fats
7.03g
60.75g
83%
Selenium
45.2µg
2.4µg
78%
Phosphorus
734mg
290mg
63%
Vitamin B1
1.17mg
0.643mg
44%
Polyunsaturated fat
2.766g
7.92g
34%
Vitamin B6
0.165mg
0.563mg
31%
Manganese
5.63mg
6.175mg
24%
Fiber
15.4g
9.7g
23%
Calories
246kcal
628kcal
19%
Carbs
66.22g
16.7g
17%
Magnesium
235mg
163mg
17%
Folate
52µg
113µg
15%
Saturated fat
1.328g
4.464g
14%
Vitamin B5
1.494mg
0.918mg
12%
Iron
5.41mg
4.7mg
9%
Vitamin K
3.2µg
14.2µg
9%
Vitamin B2
0.22mg
0.113mg
8%
Vitamin C
0mg
6.3mg
7%
Calcium
58mg
114mg
6%
Zinc
3.11mg
2.45mg
6%
Protein
17.3g
14.95g
5%
Vitamin B3
0.934mg
1.8mg
5%
Potassium
566mg
680mg
3%
Choline
32.2mg
45.6mg
2%
Protein per 100 calories
7g
2.4g
N/A
Calories per 10 g protein
142kcal
420kcal
N/A
Weight per 100 calories
41g
16g
N/A
Unsaturated / Saturated Fat ratio
3.9
12
N/A
Net carbs
50.82g
7g
N/A
Sugar
1.45g
4.34g
N/A
Starch
0.48g
0%
Sodium
4mg
0mg
0%
Vitamin A
0µg
1µg
0%
Tryptophan
0.335mg
0.193mg
0%
Threonine
0.502mg
0.497mg
0%
Isoleucine
0.668mg
0.545mg
0%
Leucine
1.374mg
1.063mg
0%
Lysine
0.76mg
0.42mg
0%
Methionine
0.335mg
0.221mg
0%
Phenylalanine
0.908mg
0.663mg
0%
Valine
0.964mg
0.701mg
0%
Histidine
0.41mg
0.432mg
0%
Fructose
0.07g
0%
Macronutrient Comparison
Macronutrient breakdown side-by-side comparison
4
17%
7%
66%
7%
3%
Protein:
17.3 g
Fats:
7.03 g
Carbs:
66.22 g
Water:
6.55 g
Other:
2.9 g
1
15%
61%
17%
5%
2%
Protein:
14.95 g
Fats:
60.75 g
Carbs:
16.7 g
Water:
5.31 g
Other:
2.29 g
Contains
more
Protein Protein
+15.7%
Contains
more
Carbs Carbs
+296.5%
Contains
more
Water Water
+23.4%
Contains
more
Other Other
+26.6%
Contains
more
Fats Fats
+764.2%
Fat Type Comparison
Fat type breakdown side-by-side comparison
1
21%
37%
43%
Saturated fat:
Sat. Fat
1.328 g
Monounsaturated fat:
Mono. Fat
2.376 g
Polyunsaturated fat:
Poly. Fat
2.766 g
2
8%
79%
14%
Saturated fat:
Sat. Fat
4.464 g
Monounsaturated fat:
Mono. Fat
45.652 g
Polyunsaturated fat:
Poly. Fat
7.92 g
Contains
less
Sat. Fat Saturated fat
-70.3%
Contains
more
Mono. Fat Monounsaturated fat
+1821.4%
Contains
more
Poly. Fat Polyunsaturated fat
+186.3%