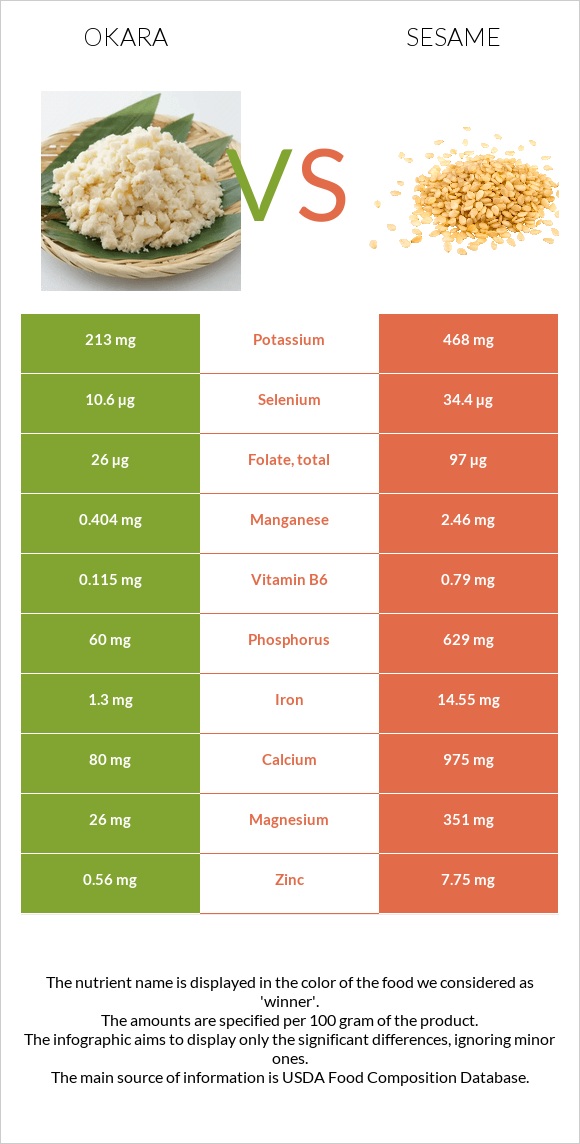
Summary of differences between okara and sesame The amount of copper, iron, calcium, manganese, phosphorus, magnesium, zinc, vitamin B1, vitamin B6, and selenium in sesame is higher than in okara. Sesame covers your daily need for copper, 431% more than okara. These are the specific foods used in this comparison Okara and Seeds, sesame seeds, whole, dried .
Infographic
Mineral Comparison
Mineral comparison score is based on the number of minerals by which one or the other food is richer. The "coverage" charts below show how much of the daily needs can be covered by 300 grams of the food.
1
100 g
300 g
1 cup - 122g
Magnesium
Magnesium
Calcium
Calcium
Potassium
Potassium
Iron
Iron
Copper
Copper
Zinc
Zinc
Phosphorus
Phosphorus
Sodium
Sodium
Manganese
Manganese
Selenium
Selenium
19%
24%
19%
49%
67%
15%
26%
1.2%
53%
58%
9
100 g
300 g
1 tbsp - 9g 1 cup - 144g
Magnesium
Magnesium
Calcium
Calcium
Potassium
Potassium
Iron
Iron
Copper
Copper
Zinc
Zinc
Phosphorus
Phosphorus
Sodium
Sodium
Manganese
Manganese
Selenium
Selenium
251%
293%
41%
546%
1361%
211%
270%
1.4%
321%
188%
Vitamin Comparison
Vitamin comparison score is based on the number of vitamins by which one or the other food is richer. The "coverage" charts below show how much of the daily needs can be covered by 300 grams of the food.
1
100 g
300 g
1 cup - 122g
Vitamin C
Vit. C
Vitamin D
Vit. D
Vitamin A
Vit. A
Vitamin E
Vit. E
Vitamin B1
Vit. B1
Vitamin B2
Vit. B2
Vitamin B3
Vit. B3
Vitamin B5
Vit. B5
Vitamin B6
Vit. B6
Vitamin B12
Vit. B12
Vitamin K
Vit. K
Folate
Folate
0%
0%
0%
0%
5%
4.6%
1.9%
5.3%
27%
0%
0%
20%
6
100 g
300 g
1 tbsp - 9g 1 cup - 144g
Vitamin C
Vit. C
Vitamin D
Vit. D
Vitamin A
Vit. A
Vitamin E
Vit. E
Vitamin B1
Vit. B1
Vitamin B2
Vit. B2
Vitamin B3
Vit. B3
Vitamin B5
Vit. B5
Vitamin B6
Vit. B6
Vitamin B12
Vit. B12
Vitamin K
Vit. K
Folate
Folate
0%
0%
0%
5%
198%
57%
85%
3%
182%
0%
0%
73%
All nutrients comparison - raw data values
Nutrient
DV% diff.
Copper
0.2mg
4.082mg
431%
Iron
1.3mg
14.55mg
166%
Polyunsaturated fat
0.755g
21.773g
140%
Calcium
80mg
975mg
90%
Manganese
0.404mg
2.46mg
89%
Phosphorus
60mg
629mg
81%
Magnesium
26mg
351mg
77%
Fats
1.73g
49.67g
74%
Zinc
0.56mg
7.75mg
65%
Vitamin B1
0.02mg
0.791mg
64%
Vitamin B6
0.115mg
0.79mg
52%
Fiber
11.8g
47%
Monounsaturated fat
0.295g
18.759g
46%
Selenium
10.6µg
34.4µg
43%
Saturated fat
0.193g
6.957g
31%
Protein
3.52g
17.73g
28%
Vitamin B3
0.1mg
4.515mg
28%
Calories
76kcal
573kcal
25%
Folate
26µg
97µg
18%
Vitamin B2
0.02mg
0.247mg
17%
Potassium
213mg
468mg
8%
Choline
25.6mg
5%
Carbs
12.23g
23.45g
4%
Vitamin E
0.25mg
2%
Vitamin B5
0.088mg
0.05mg
1%
Protein per 100 calories
4.6g
3.1g
N/A
Calories per 10 g protein
216kcal
323kcal
N/A
Weight per 100 calories
132g
17g
N/A
Unsaturated / Saturated Fat ratio
5.4
5.8
N/A
Net carbs
12.23g
11.65g
N/A
Sugar
0.3g
N/A
Sodium
9mg
11mg
0%
Tryptophan
0.05mg
0.388mg
0%
Threonine
0.131mg
0.736mg
0%
Isoleucine
0.159mg
0.763mg
0%
Leucine
0.244mg
1.358mg
0%
Lysine
0.212mg
0.569mg
0%
Methionine
0.041mg
0.586mg
0%
Phenylalanine
0.157mg
0.94mg
0%
Valine
0.162mg
0.99mg
0%
Histidine
0.093mg
0.522mg
0%
Macronutrient Comparison
Macronutrient breakdown side-by-side comparison
1
4%
2%
12%
82%
Protein:
3.52 g
Fats:
1.73 g
Carbs:
12.23 g
Water:
81.64 g
Other:
0.88 g
4
18%
50%
23%
5%
4%
Protein:
17.73 g
Fats:
49.67 g
Carbs:
23.45 g
Water:
4.69 g
Other:
4.46 g
Contains
more
Water Water
+1640.7%
Contains
more
Protein Protein
+403.7%
Contains
more
Fats Fats
+2771.1%
Contains
more
Carbs Carbs
+91.7%
Contains
more
Other Other
+406.8%
Fat Type Comparison
Fat type breakdown side-by-side comparison
1
16%
24%
61%
Saturated fat:
Sat. Fat
0.193 g
Monounsaturated fat:
Mono. Fat
0.295 g
Polyunsaturated fat:
Poly. Fat
0.755 g
2
15%
40%
46%
Saturated fat:
Sat. Fat
6.957 g
Monounsaturated fat:
Mono. Fat
18.759 g
Polyunsaturated fat:
Poly. Fat
21.773 g
Contains
less
Sat. Fat Saturated fat
-97.2%
Contains
more
Mono. Fat Monounsaturated fat
+6259%
Contains
more
Poly. Fat Polyunsaturated fat
+2783.8%