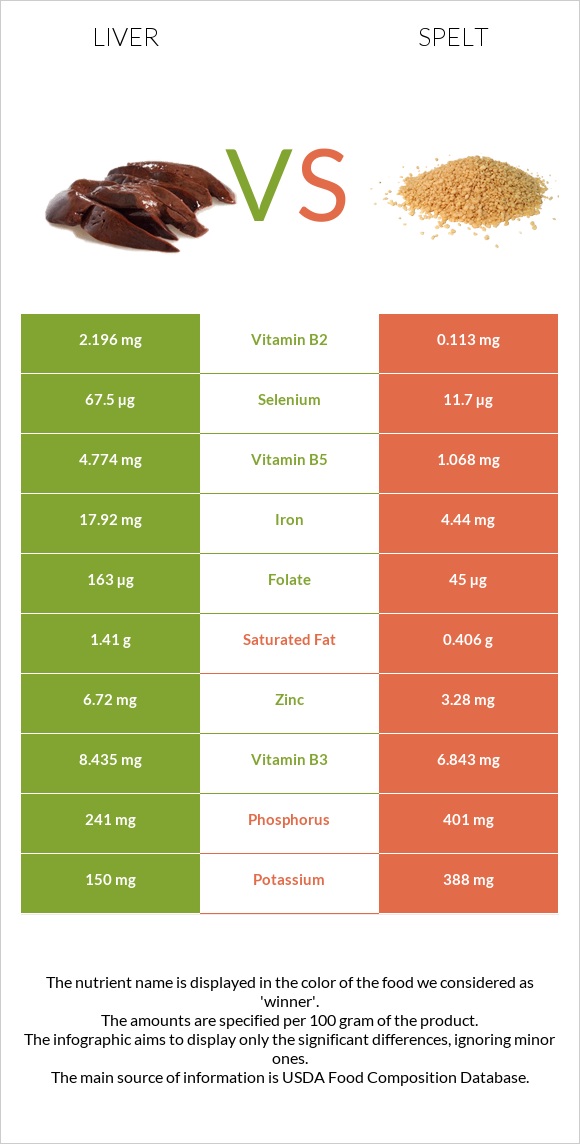
Differences between liver and spelt Liver is higher in vitamin B12, vitamin A, iron, vitamin B2, selenium, vitamin B5, and zinc; however, spelt is richer in manganese and fiber. Liver's daily need coverage for vitamin B12 is 778% higher. Liver has a lower glycemic index (0) than spelt (63). The food types used in this comparison are Pork, fresh, variety meats, and by-products, liver, cooked, braised and Spelt, uncooked .
Infographic
Mineral Comparison
Mineral comparison score is based on the number of minerals by which one or the other food is richer. The "coverage" charts below show how much of the daily needs can be covered by 300 grams of the food.
4
100 g
300 g
3 oz - 85g
Magnesium
Magnesium
Calcium
Calcium
Potassium
Potassium
Iron
Iron
Copper
Copper
Zinc
Zinc
Phosphorus
Phosphorus
Sodium
Sodium
Manganese
Manganese
Selenium
Selenium
10%
3%
13%
672%
211%
183%
103%
6.4%
39%
368%
6
100 g
300 g
1 cup - 174g
Magnesium
Magnesium
Calcium
Calcium
Potassium
Potassium
Iron
Iron
Copper
Copper
Zinc
Zinc
Phosphorus
Phosphorus
Sodium
Sodium
Manganese
Manganese
Selenium
Selenium
97%
8.1%
34%
167%
170%
89%
172%
1%
389%
64%
Vitamin Comparison
Vitamin comparison score is based on the number of vitamins by which one or the other food is richer. The "coverage" charts below show how much of the daily needs can be covered by 300 grams of the food.
8
100 g
300 g
3 oz - 85g
Vitamin C
Vit. C
Vitamin D
Vit. D
Vitamin A
Vit. A
Vitamin E
Vit. E
Vitamin B1
Vit. B1
Vitamin B2
Vit. B2
Vitamin B3
Vit. B3
Vitamin B5
Vit. B5
Vitamin B6
Vit. B6
Vitamin B12
Vit. B12
Vitamin K
Vit. K
Folate
Folate
79%
0%
1802%
0%
65%
507%
158%
286%
132%
2334%
0%
122%
3
100 g
300 g
1 cup - 174g
Vitamin C
Vit. C
Vitamin D
Vit. D
Vitamin A
Vit. A
Vitamin E
Vit. E
Vitamin B1
Vit. B1
Vitamin B2
Vit. B2
Vitamin B3
Vit. B3
Vitamin B5
Vit. B5
Vitamin B6
Vit. B6
Vitamin B12
Vit. B12
Vitamin K
Vit. K
Folate
Folate
0%
0%
0%
16%
91%
26%
128%
64%
53%
0%
9%
34%
All nutrients comparison - raw data values
Nutrient
DV% diff.
Vitamin B12
18.67µg
0µg
778%
Vitamin A
5405µg
0µg
601%
Iron
17.92mg
4.44mg
169%
Vitamin B2
2.196mg
0.113mg
160%
Cholesterol
355mg
0mg
118%
Manganese
0.3mg
2.983mg
117%
Selenium
67.5µg
11.7µg
101%
Vitamin B5
4.774mg
1.068mg
74%
Fiber
0g
10.7g
43%
Zinc
6.72mg
3.28mg
31%
Folate
163µg
45µg
30%
Magnesium
14mg
136mg
29%
Vitamin C
23.6mg
0mg
26%
Vitamin B6
0.57mg
0.23mg
26%
Protein
26.02g
14.57g
23%
Phosphorus
241mg
401mg
23%
Carbs
3.76g
70.19g
22%
Starch
53.92g
22%
Copper
0.634mg
0.511mg
14%
Vitamin B3
8.435mg
6.843mg
10%
Calories
165kcal
338kcal
9%
Vitamin B1
0.258mg
0.364mg
9%
Potassium
150mg
388mg
7%
Vitamin E
0.79mg
5%
Saturated fat
1.41g
0.406g
5%
Fats
4.4g
2.43g
3%
Vitamin K
3.6µg
3%
Calcium
10mg
27mg
2%
Sodium
49mg
8mg
2%
Polyunsaturated fat
1.05g
1.258g
1%
Protein per 100 calories
16g
4.3g
N/A
Calories per 10 g protein
63kcal
232kcal
N/A
Weight per 100 calories
61g
30g
N/A
Unsaturated / Saturated Fat ratio
1.2
4.2
N/A
Net carbs
3.76g
59.49g
N/A
Sugar
6.82g
N/A
Monounsaturated fat
0.63g
0.445g
0%
Tryptophan
0.366mg
0.132mg
0%
Threonine
1.107mg
0.443mg
0%
Isoleucine
1.32mg
0.552mg
0%
Leucine
2.319mg
1.07mg
0%
Lysine
2.007mg
0.409mg
0%
Methionine
0.645mg
0.258mg
0%
Phenylalanine
1.274mg
0.737mg
0%
Valine
1.607mg
0.681mg
0%
Histidine
0.708mg
0.36mg
0%
Fructose
0.24g
0%
Omega-3 - DHA
0.03g
N/A
Omega-3 - ALA
0.065g
N/A
Omega-3 - DPA
0.04g
N/A
Macronutrient Comparison
Macronutrient breakdown side-by-side comparison
3
26%
4%
4%
64%
Protein:
26.02 g
Fats:
4.4 g
Carbs:
3.76 g
Water:
64.32 g
Other:
1.5 g
2
15%
2%
70%
11%
2%
Protein:
14.57 g
Fats:
2.43 g
Carbs:
70.19 g
Water:
11.02 g
Other:
1.79 g
Contains
more
Protein Protein
+78.6%
Contains
more
Fats Fats
+81.1%
Contains
more
Water Water
+483.7%
Contains
more
Carbs Carbs
+1766.8%
Contains
more
Other Other
+19.3%
Fat Type Comparison
Fat type breakdown side-by-side comparison
1
46%
20%
34%
Saturated fat:
Sat. Fat
1.41 g
Monounsaturated fat:
Mono. Fat
0.63 g
Polyunsaturated fat:
Poly. Fat
1.05 g
2
19%
21%
60%
Saturated fat:
Sat. Fat
0.406 g
Monounsaturated fat:
Mono. Fat
0.445 g
Polyunsaturated fat:
Poly. Fat
1.258 g
Contains
more
Mono. Fat Monounsaturated fat
+41.6%
Contains
less
Sat. Fat Saturated fat
-71.2%
Contains
more
Poly. Fat Polyunsaturated fat
+19.8%