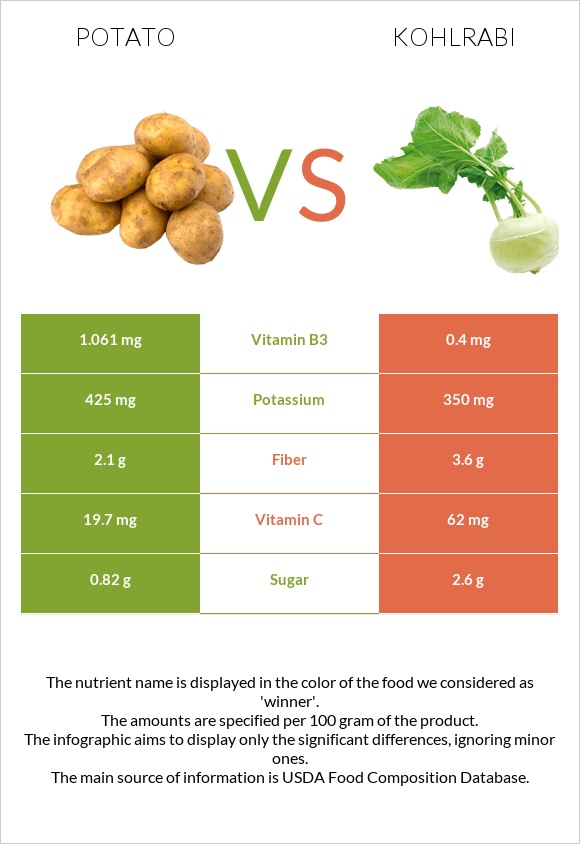
Summary of differences between potatoes and kohlrabi Potatoes have more vitamin B6 and iron, while kohlrabi has more vitamin C and fiber. Kohlrabi covers your daily need for vitamin C, 47% more than potatoes. Potatoes contain 3 times more vitamin B3 than kohlrabi. While potatoes contain 1.061mg of vitamin B3, kohlrabi contains only 0.4mg. The amount of sugar in potatoes is lower. Kohlrabi has a lower glycemic index. The glycemic index of kohlrabi is 20, while the glycemic index of potatoes is 86. These are the specific foods used in this comparison Potatoes, flesh, and skin, raw and Kohlrabi, raw .
Infographic
Mineral Comparison
Mineral comparison score is based on the number of minerals by which one or the other food is richer. The "coverage" charts below show how much of the daily needs can be covered by 300 grams of the food.
7
100 g
300 g
0.5 cup, diced - 75g 1 Potato small (1-3/4" to 2-1/2" dia) - 170g 1 Potato medium (2-1/4" to 3-1/4" dia) - 213g 1 Potato large (3" to 4-1/4" dia) - 369g
Magnesium
Magnesium
Calcium
Calcium
Potassium
Potassium
Iron
Iron
Copper
Copper
Zinc
Zinc
Phosphorus
Phosphorus
Sodium
Sodium
Manganese
Manganese
Selenium
Selenium
16%
3.6%
38%
30%
37%
8.2%
24%
0.78%
26%
2.2%
3
100 g
300 g
1 slice - 16g 1 cup - 135g
Magnesium
Magnesium
Calcium
Calcium
Potassium
Potassium
Iron
Iron
Copper
Copper
Zinc
Zinc
Phosphorus
Phosphorus
Sodium
Sodium
Manganese
Manganese
Selenium
Selenium
14%
7.2%
31%
15%
43%
0.82%
20%
2.6%
18%
3.8%
Vitamin Comparison
Vitamin comparison score is based on the number of vitamins by which one or the other food is richer. The "coverage" charts below show how much of the daily needs can be covered by 300 grams of the food.
6
100 g
300 g
0.5 cup, diced - 75g 1 Potato small (1-3/4" to 2-1/2" dia) - 170g 1 Potato medium (2-1/4" to 3-1/4" dia) - 213g 1 Potato large (3" to 4-1/4" dia) - 369g
Vitamin C
Vit. C
Vitamin D
Vit. D
Vitamin A
Vit. A
Vitamin E
Vit. E
Vitamin B1
Vit. B1
Vitamin B2
Vit. B2
Vitamin B3
Vit. B3
Vitamin B5
Vit. B5
Vitamin B6
Vit. B6
Vitamin B12
Vit. B12
Vitamin K
Vit. K
Folate
Folate
66%
0%
0%
0.2%
20%
7.4%
20%
18%
69%
0%
5%
11%
3
100 g
300 g
1 slice - 16g 1 cup - 135g
Vitamin C
Vit. C
Vitamin D
Vit. D
Vitamin A
Vit. A
Vitamin E
Vit. E
Vitamin B1
Vit. B1
Vitamin B2
Vit. B2
Vitamin B3
Vit. B3
Vitamin B5
Vit. B5
Vitamin B6
Vit. B6
Vitamin B12
Vit. B12
Vitamin K
Vit. K
Folate
Folate
207%
0%
0.67%
9.6%
13%
4.6%
7.5%
9.9%
35%
0%
0.25%
12%
All nutrients comparison - raw data values
Nutrient
DV% diff.
Vitamin C
19.7mg
62mg
47%
Vitamin B6
0.298mg
0.15mg
11%
Fiber
2.1g
3.6g
6%
Starch
15.29g
6%
Iron
0.81mg
0.4mg
5%
Carbs
17.49g
6.2g
4%
Vitamin B3
1.061mg
0.4mg
4%
Calories
77kcal
27kcal
3%
Vitamin E
0.01mg
0.48mg
3%
Manganese
0.2mg
0.139mg
3%
Vitamin B1
0.081mg
0.05mg
3%
Vitamin B5
0.295mg
0.165mg
3%
Potassium
425mg
350mg
2%
Copper
0.11mg
0.129mg
2%
Zinc
0.3mg
0.03mg
2%
Phosphorus
57mg
46mg
2%
Vitamin K
2µg
0.1µg
2%
Protein
2.05g
1.7g
1%
Magnesium
23mg
19mg
1%
Calcium
12mg
24mg
1%
Sodium
6mg
20mg
1%
Selenium
0.4µg
0.7µg
1%
Vitamin B2
0.032mg
0.02mg
1%
Protein per 100 calories
2.7g
6.3g
N/A
Calories per 10 g protein
376kcal
159kcal
N/A
Weight per 100 calories
130g
370g
N/A
Fats
0.09g
0.1g
0%
Net carbs
15.39g
2.6g
N/A
Sugar
0.82g
2.6g
N/A
Vitamin A
0µg
2µg
0%
Folate
15µg
16µg
0%
Choline
12.1mg
12.3mg
0%
Saturated fat
0.025g
0.013g
0%
Monounsaturated fat
0.002g
0.007g
0%
Polyunsaturated fat
0.042g
0.048g
0%
Tryptophan
0.021mg
0.01mg
0%
Threonine
0.067mg
0.049mg
0%
Isoleucine
0.066mg
0.078mg
0%
Leucine
0.098mg
0.067mg
0%
Lysine
0.107mg
0.056mg
0%
Methionine
0.032mg
0.013mg
0%
Phenylalanine
0.081mg
0.039mg
0%
Valine
0.103mg
0.05mg
0%
Histidine
0.035mg
0.019mg
0%
Fructose
0.26g
0%
Macronutrient Comparison
Macronutrient breakdown side-by-side comparison
3
2%
17%
79%
Protein:
2.05 g
Fats:
0.09 g
Carbs:
17.49 g
Water:
79.25 g
Other:
1.12 g
2
2%
6%
91%
Protein:
1.7 g
Fats:
0.1 g
Carbs:
6.2 g
Water:
91 g
Other:
1 g
Contains
more
Protein Protein
+20.6%
Contains
more
Carbs Carbs
+182.1%
Contains
more
Other Other
+12%
Contains
more
Fats Fats
+11.1%
Contains
more
Water Water
+14.8%
Fat Type Comparison
Fat type breakdown side-by-side comparison
0
36%
3%
61%
Saturated fat:
Sat. Fat
0.025 g
Monounsaturated fat:
Mono. Fat
0.002 g
Polyunsaturated fat:
Poly. Fat
0.042 g
3
19%
10%
71%
Saturated fat:
Sat. Fat
0.013 g
Monounsaturated fat:
Mono. Fat
0.007 g
Polyunsaturated fat:
Poly. Fat
0.048 g
Contains
less
Sat. Fat Saturated fat
-48%
Contains
more
Mono. Fat Monounsaturated fat
+250%
Contains
more
Poly. Fat Polyunsaturated fat
+14.3%