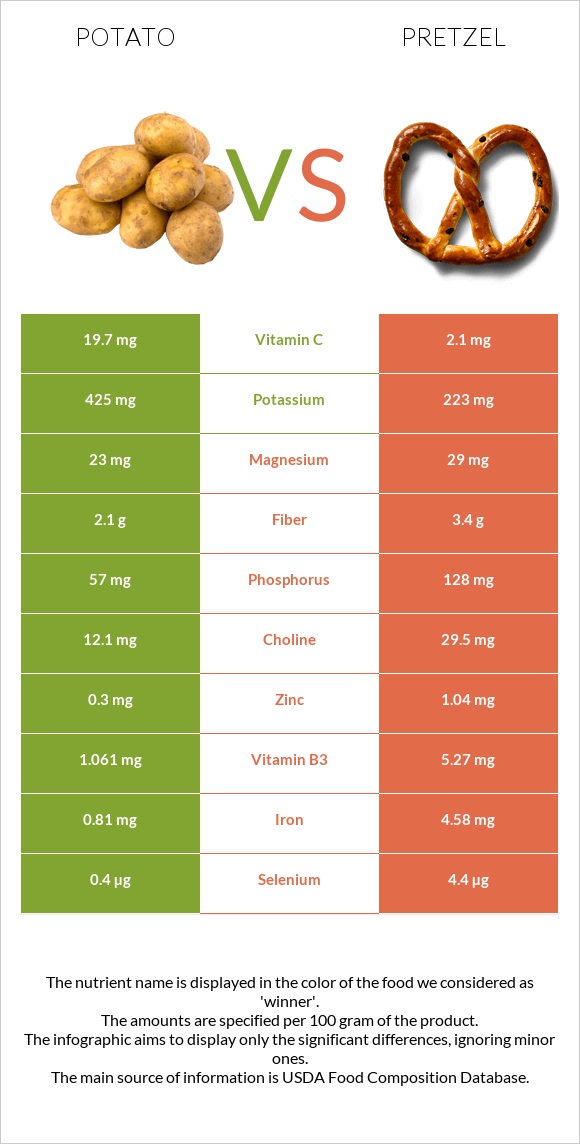
How are potatoes and pretzel different? Potatoes are higher in vitamin C and vitamin B6; however, pretzel is richer in iron, folate, manganese, vitamin B1, vitamin B3, vitamin B2, and phosphorus. Daily need coverage for sodium for pretzel is 54% higher. Potatoes contain 9 times more vitamin C than pretzel. While potatoes contain 19.7mg of vitamin C, pretzel contains only 2.1mg. Potatoes have less sodium. Potatoes, flesh, and skin, raw and Snacks, pretzels, hard, plain, salted are the varieties used in this article.
Infographic
Mineral Comparison
Mineral comparison score is based on the number of minerals by which one or the other food is richer. The "coverage" charts below show how much of the daily needs can be covered by 300 grams of the food.
2
100 g
300 g
0.5 cup, diced - 75g 1 Potato small (1-3/4" to 2-1/2" dia) - 170g 1 Potato medium (2-1/4" to 3-1/4" dia) - 213g 1 Potato large (3" to 4-1/4" dia) - 369g
Magnesium
Magnesium
Calcium
Calcium
Potassium
Potassium
Iron
Iron
Copper
Copper
Zinc
Zinc
Phosphorus
Phosphorus
Sodium
Sodium
Manganese
Manganese
Selenium
Selenium
16%
3.6%
38%
30%
37%
8.2%
24%
0.78%
26%
2.2%
8
100 g
300 g
1 oz - 28.35g 10 twists - 60g
Magnesium
Magnesium
Calcium
Calcium
Potassium
Potassium
Iron
Iron
Copper
Copper
Zinc
Zinc
Phosphorus
Phosphorus
Sodium
Sodium
Manganese
Manganese
Selenium
Selenium
21%
8.1%
20%
172%
52%
28%
55%
162%
132%
24%
Vitamin Comparison
Vitamin comparison score is based on the number of vitamins by which one or the other food is richer. The "coverage" charts below show how much of the daily needs can be covered by 300 grams of the food.
2
100 g
300 g
0.5 cup, diced - 75g 1 Potato small (1-3/4" to 2-1/2" dia) - 170g 1 Potato medium (2-1/4" to 3-1/4" dia) - 213g 1 Potato large (3" to 4-1/4" dia) - 369g
Vitamin C
Vit. C
Vitamin D
Vit. D
Vitamin A
Vit. A
Vitamin E
Vit. E
Vitamin B1
Vit. B1
Vitamin B2
Vit. B2
Vitamin B3
Vit. B3
Vitamin B5
Vit. B5
Vitamin B6
Vit. B6
Vitamin B12
Vit. B12
Vitamin K
Vit. K
Folate
Folate
66%
0%
0%
0.2%
20%
7.4%
20%
18%
69%
0%
5%
11%
6
100 g
300 g
1 oz - 28.35g 10 twists - 60g
Vitamin C
Vit. C
Vitamin D
Vit. D
Vitamin A
Vit. A
Vitamin E
Vit. E
Vitamin B1
Vit. B1
Vitamin B2
Vit. B2
Vitamin B3
Vit. B3
Vitamin B5
Vit. B5
Vitamin B6
Vit. B6
Vitamin B12
Vit. B12
Vitamin K
Vit. K
Folate
Folate
7%
0%
0%
9.4%
106%
77%
99%
19%
17%
0%
7%
125%
All nutrients comparison - raw data values
Nutrient
DV% diff.
Sodium
6mg
1240mg
54%
Iron
0.81mg
4.58mg
47%
Folate
15µg
166µg
38%
Manganese
0.2mg
1.015mg
35%
Vitamin B1
0.081mg
0.424mg
29%
Vitamin B3
1.061mg
5.27mg
26%
Starch
15.29g
72.58g
24%
Vitamin B2
0.032mg
0.332mg
23%
Carbs
17.49g
80.39g
21%
Vitamin C
19.7mg
2.1mg
20%
Vitamin B6
0.298mg
0.074mg
17%
Protein
2.05g
10.04g
16%
Calories
77kcal
384kcal
15%
Phosphorus
57mg
128mg
10%
Polyunsaturated fat
0.042g
1.291g
8%
Zinc
0.3mg
1.04mg
7%
Selenium
0.4µg
4.4µg
7%
Potassium
425mg
223mg
6%
Fiber
2.1g
3.4g
5%
Copper
0.11mg
0.156mg
5%
Fats
0.09g
2.93g
4%
Vitamin E
0.01mg
0.47mg
3%
Choline
12.1mg
29.5mg
3%
Calcium
12mg
27mg
2%
Saturated fat
0.025g
0.391g
2%
Monounsaturated fat
0.002g
0.727g
2%
Magnesium
23mg
29mg
1%
Vitamin B5
0.295mg
0.322mg
1%
Vitamin K
2µg
2.8µg
1%
Protein per 100 calories
2.7g
2.6g
N/A
Calories per 10 g protein
376kcal
382kcal
N/A
Weight per 100 calories
130g
26g
N/A
Unsaturated / Saturated Fat ratio
1.8
5.2
N/A
Net carbs
15.39g
76.99g
N/A
Sugar
0.82g
2.21g
N/A
Trans fat
0g
0.004g
N/A
Tryptophan
0.021mg
0.097mg
0%
Threonine
0.067mg
0.25mg
0%
Isoleucine
0.066mg
0.407mg
0%
Leucine
0.098mg
0.757mg
0%
Lysine
0.107mg
0.257mg
0%
Methionine
0.032mg
0.177mg
0%
Phenylalanine
0.081mg
0.52mg
0%
Valine
0.103mg
0.48mg
0%
Histidine
0.035mg
0.22mg
0%
Fructose
0.26g
0.31g
0%
Omega-3 - ALA
0.063g
N/A
Omega-6 - Gamma-linoleic acid
0.001g
N/A
Omega-6 - Linoleic acid
1.223g
N/A
Macronutrient Comparison
Macronutrient breakdown side-by-side comparison
1
2%
17%
79%
Protein:
2.05 g
Fats:
0.09 g
Carbs:
17.49 g
Water:
79.25 g
Other:
1.12 g
4
10%
3%
80%
3%
4%
Protein:
10.04 g
Fats:
2.93 g
Carbs:
80.39 g
Water:
3.13 g
Other:
3.51 g
Contains
more
Water Water
+2431.9%
Contains
more
Protein Protein
+389.8%
Contains
more
Fats Fats
+3155.6%
Contains
more
Carbs Carbs
+359.6%
Contains
more
Other Other
+213.4%
Fat Type Comparison
Fat type breakdown side-by-side comparison
1
36%
3%
61%
Saturated fat:
Sat. Fat
0.025 g
Monounsaturated fat:
Mono. Fat
0.002 g
Polyunsaturated fat:
Poly. Fat
0.042 g
2
16%
30%
54%
Saturated fat:
Sat. Fat
0.391 g
Monounsaturated fat:
Mono. Fat
0.727 g
Polyunsaturated fat:
Poly. Fat
1.291 g
Contains
less
Sat. Fat Saturated fat
-93.6%
Contains
more
Mono. Fat Monounsaturated fat
+36250%
Contains
more
Poly. Fat Polyunsaturated fat
+2973.8%
Carbohydrate type comparison
Carbohydrate type breakdown side-by-side comparison
1
95%
2%
Starch:
15.29 g
Sucrose:
0.17 g
Glucose:
0.31 g
Fructose:
0.26 g
Lactose:
0 g
Maltose:
0 g
Galactose:
0 g
4
97%
Starch:
72.58 g
Sucrose:
0 g
Glucose:
0.69 g
Fructose:
0.31 g
Lactose:
0 g
Maltose:
1.11 g
Galactose:
0 g
Contains
more
Sucrose Sucrose
+∞%
Contains
more
Starch Starch
+374.7%
Contains
more
Glucose Glucose
+122.6%
Contains
more
Fructose Fructose
+19.2%
Contains
more
Maltose Maltose
+∞%
~equal in
Lactose
~0g
~equal in
Galactose
~0g