
Rolls, hamburger or hot dog, wheat/cracked wheat vs. Dinner rolls — In-Depth Nutrition Comparison
Compare
The main differences between rolls, hamburger or hot dog, wheat/cracked wheat and dinner rolls
- Rolls, hamburger or hot dog, wheat/cracked wheat has more manganese, fiber, and magnesium; however, dinner rolls have more iron and vitamin B2.
- Daily need coverage for manganese for rolls, hamburger or hot dog, wheat/cracked wheat is 28% higher.
- Dinner rolls have 2 times less fiber than rolls, hamburger or hot dog, wheat/cracked wheat. Rolls, hamburger or hot dog, wheat/cracked wheat has 4.2g of fiber, while dinner rolls have 2g.
Food types used in this article are Rolls, hamburger or hot dog, wheat/cracked wheat and Rolls, dinner, plain, commercially prepared (includes brown-and-serve).
Infographic
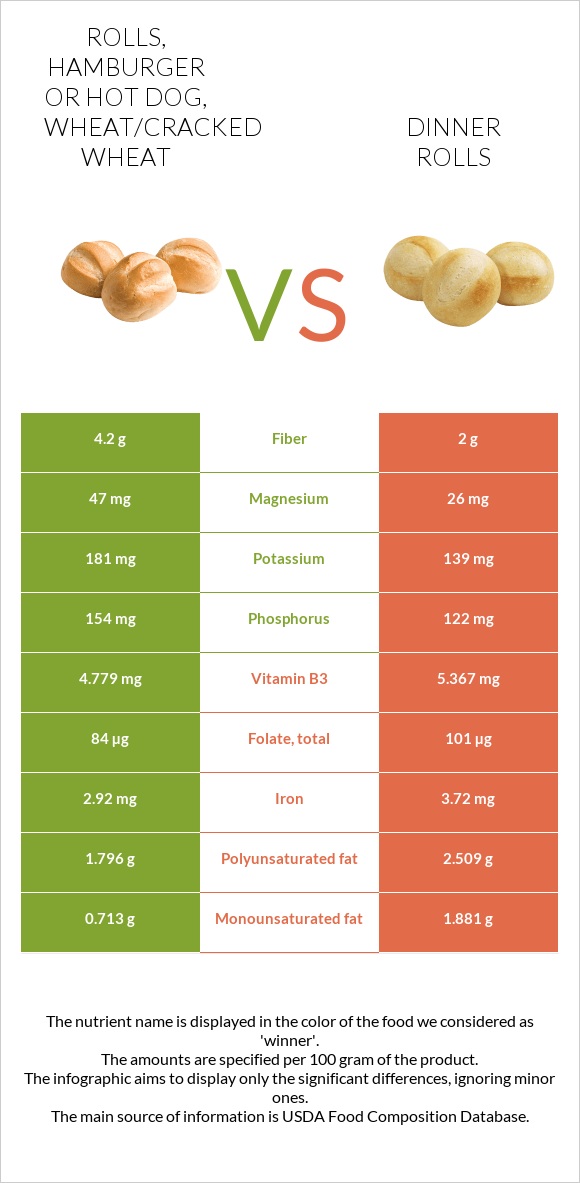
Infographic link
Mineral Comparison
The mineral comparison score is based on which food has a more favorable amount of each mineral. The �coverage� charts below show how much of the daily mineral needs are covered by the selected amount of each food.
| Contains more MagnesiumMagnesium | +80.8% |
| Contains more PotassiumPotassium | +30.2% |
| Contains more CopperCopper | +22.2% |
| Contains more ZincZinc | +18.2% |
| Contains more PhosphorusPhosphorus | +26.2% |
| Contains more ManganeseManganese | +111.7% |
| Contains more IronIron | +27.4% |
Vitamin Comparison
The vitamin comparison score is based on the number of vitamins in which one food is richer than the other. The �coverage� charts below show how much of the daily vitamin needs are covered by the selected amount of each food.
| Contains more Vitamin CVitamin C | +550% |
| Contains more Vitamin AVitamin A | +2600% |
| Contains more Vitamin EVitamin E | +42.9% |
| Contains more Vitamin B5Vitamin B5 | +45.6% |
| Contains more Vitamin B6Vitamin B6 | +30.9% |
| Contains more Vitamin B12Vitamin B12 | +46.2% |
| Contains more Vitamin B2Vitamin B2 | +28.5% |
| Contains more Vitamin B3Vitamin B3 | +12.3% |
| Contains more Vitamin KVitamin K | +55.9% |
| Contains more FolateFolate | +20.2% |
All nutrients comparison - raw data values
| Nutrient |  |
 |
DV% diff. |
| Manganese | 1.232mg | 0.582mg | 28% |
| Starch | 31.38g | 13% | |
| Iron | 2.92mg | 3.72mg | 10% |
| Fiber | 4.2g | 2g | 9% |
| Omega-6 (Linoleic acid) | 1.604g | 9% | |
| Vitamin B2 | 0.291mg | 0.374mg | 6% |
| Magnesium | 47mg | 26mg | 5% |
| Phosphorus | 154mg | 122mg | 5% |
| Polyunsaturated fat | 1.796g | 2.509g | 5% |
| Fats | 3.61g | 6.47g | 4% |
| Vitamin B3 | 4.779mg | 5.367mg | 4% |
| Vitamin B5 | 0.658mg | 0.452mg | 4% |
| Folate | 84µg | 101µg | 4% |
| Fructose | 2.99g | 4% | |
| Copper | 0.165mg | 0.135mg | 3% |
| Vitamin A | 27µg | 1µg | 3% |
| Vitamin B12 | 0.19µg | 0.13µg | 3% |
| Vitamin K | 6.8µg | 10.6µg | 3% |
| Saturated fat | 0.746g | 1.375g | 3% |
| Monounsaturated fat | 0.713g | 1.881g | 3% |
| Omega-3 (ALA) | 0.179g | 0.224g | 3% |
| Calories | 269kcal | 310kcal | 2% |
| Protein | 11.69g | 10.86g | 2% |
| Carbs | 47.31g | 52.04g | 2% |
| Calcium | 196mg | 178mg | 2% |
| Zinc | 1.17mg | 0.99mg | 2% |
| Vitamin B6 | 0.127mg | 0.097mg | 2% |
| Vitamin C | 1.3mg | 0.2mg | 1% |
| Cholesterol | 0mg | 4mg | 1% |
| Potassium | 181mg | 139mg | 1% |
| Vitamin E | 0.4mg | 0.28mg | 1% |
| Vitamin B1 | 0.532mg | 0.526mg | 1% |
| Protein per 100 calories | 4.3g | 3.5g | N/A |
| Calories per 10 g protein | 230kcal | 285kcal | N/A |
| Weight per 100 calories | 37g | 32g | N/A |
| Unsaturated / Saturated Fat ratio | 3.4 | 3.2 | N/A |
| Net carbs | 43.11g | 50.04g | N/A |
| Sugar | 6.9g | 5.55g | N/A |
| Sodium | 463mg | 467mg | 0% |
| Selenium | 26.7µg | 26.8µg | 0% |
| Trans fat | 0.018g | 0g | N/A |
| Choline | 14.5mg | 14.6mg | 0% |
| Tryptophan | 0.081mg | 0% | |
| Threonine | 0.286mg | 0% | |
| Isoleucine | 0.337mg | 0% | |
| Leucine | 0.729mg | 0% | |
| Lysine | 0.233mg | 0% | |
| Methionine | 0.145mg | 0% | |
| Phenylalanine | 0.506mg | 0% | |
| Valine | 0.401mg | 0% | |
| Histidine | 0.222mg | 0% | |
| Omega-3 (DHA) | 0g | 0.001g | N/A |
| Omega-6 (Gamma-linolenic acid) | 0.006g | 0g | N/A |
| Omega-6 (Eicosadienoic acid) | 0.002g | 0g | N/A |
Macronutrient Comparison
Macronutrient breakdown side-by-side comparison
Protein:
11.69 g
Fats:
3.61 g
Carbs:
47.31 g
Water:
35.23 g
Other:
2.16 g
Protein:
10.86 g
Fats:
6.47 g
Carbs:
52.04 g
Water:
28.44 g
Other:
2.19 g
| Contains more WaterWater | +23.9% |
| Contains more FatsFats | +79.2% |
~equal in
Protein
~10.86g
~equal in
Carbs
~52.04g
Fat Type Comparison
Fat type breakdown side-by-side comparison
Saturated fat:
Sat. Fat
0.746 g
Monounsaturated fat:
Mono. Fat
0.713 g
Polyunsaturated fat:
Poly. Fat
1.796 g
Saturated fat:
Sat. Fat
1.375 g
Monounsaturated fat:
Mono. Fat
1.881 g
Polyunsaturated fat:
Poly. Fat
2.509 g
| Contains less Sat. FatSaturated fat | -45.7% |
| Contains more Mono. FatMonounsaturated fat | +163.8% |
| Contains more Poly. FatPolyunsaturated fat | +39.7% |