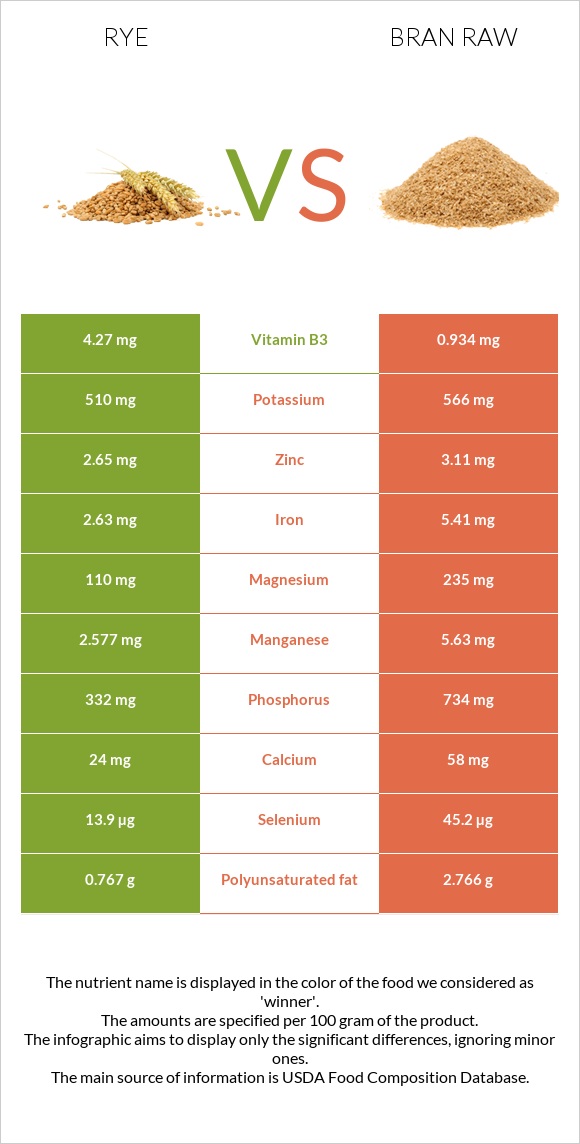
A recap on the differences between rye and bran raw Rye has more vitamin B3 and vitamin B6; however, bran raw is higher in manganese, vitamin B1, phosphorus, selenium, iron, and magnesium. Bran raw covers your daily manganese needs 133% more than rye. Bran raw contains 5 times less vitamin B3 than rye. Rye contains 4.27mg of vitamin B3, while bran raw contains 0.934mg. Rye has less saturated fat. The glycemic index of bran raw is higher. Food varieties used in this article are Rye grain and Oat bran, raw .
Infographic
Mineral Comparison
Mineral comparison score is based on the number of minerals by which one or the other food is richer. The "coverage" charts below show how much of the daily needs can be covered by 300 grams of the food.
1
100 g
300 g
1 cup - 169g
Magnesium
Magnesium
Calcium
Calcium
Potassium
Potassium
Iron
Iron
Copper
Copper
Zinc
Zinc
Phosphorus
Phosphorus
Sodium
Sodium
Manganese
Manganese
Selenium
Selenium
79%
7.2%
45%
99%
122%
72%
142%
0.26%
336%
76%
8
100 g
300 g
1 cup - 94g
Magnesium
Magnesium
Calcium
Calcium
Potassium
Potassium
Iron
Iron
Copper
Copper
Zinc
Zinc
Phosphorus
Phosphorus
Sodium
Sodium
Manganese
Manganese
Selenium
Selenium
168%
17%
50%
203%
134%
85%
315%
0.52%
734%
247%
Vitamin Comparison
Vitamin comparison score is based on the number of vitamins by which one or the other food is richer. The "coverage" charts below show how much of the daily needs can be covered by 300 grams of the food.
5
100 g
300 g
1 cup - 169g
Vitamin C
Vit. C
Vitamin D
Vit. D
Vitamin A
Vit. A
Vitamin E
Vit. E
Vitamin B1
Vit. B1
Vitamin B2
Vit. B2
Vitamin B3
Vit. B3
Vitamin B5
Vit. B5
Vitamin B6
Vit. B6
Vitamin B12
Vit. B12
Vitamin K
Vit. K
Folate
Folate
0%
0%
0.33%
17%
79%
58%
80%
87%
68%
0%
15%
29%
3
100 g
300 g
1 cup - 94g
Vitamin C
Vit. C
Vitamin D
Vit. D
Vitamin A
Vit. A
Vitamin E
Vit. E
Vitamin B1
Vit. B1
Vitamin B2
Vit. B2
Vitamin B3
Vit. B3
Vitamin B5
Vit. B5
Vitamin B6
Vit. B6
Vitamin B12
Vit. B12
Vitamin K
Vit. K
Folate
Folate
0%
0%
0%
20%
293%
51%
18%
90%
38%
0%
8%
39%
All nutrients comparison - raw data values
Nutrient
DV% diff.
Manganese
2.577mg
5.63mg
133%
Vitamin B1
0.316mg
1.17mg
71%
Phosphorus
332mg
734mg
57%
Selenium
13.9µg
45.2µg
57%
Iron
2.63mg
5.41mg
35%
Magnesium
110mg
235mg
30%
Vitamin B3
4.27mg
0.934mg
21%
Protein
10.34g
17.3g
14%
Polyunsaturated fat
0.767g
2.766g
13%
Vitamin B6
0.294mg
0.165mg
10%
Fats
1.63g
7.03g
8%
Calories
338kcal
246kcal
5%
Saturated fat
0.197g
1.328g
5%
Monounsaturated fat
0.208g
2.376g
5%
Copper
0.367mg
0.403mg
4%
Zinc
2.65mg
3.11mg
4%
Folate
38µg
52µg
4%
Carbs
75.86g
66.22g
3%
Calcium
24mg
58mg
3%
Potassium
510mg
566mg
2%
Vitamin B2
0.251mg
0.22mg
2%
Vitamin K
5.9µg
3.2µg
2%
Fiber
15.1g
15.4g
1%
Vitamin E
0.85mg
1.01mg
1%
Vitamin B5
1.456mg
1.494mg
1%
Protein per 100 calories
3.1g
7g
N/A
Calories per 10 g protein
327kcal
142kcal
N/A
Weight per 100 calories
30g
41g
N/A
Unsaturated / Saturated Fat ratio
4.9
3.9
N/A
Net carbs
60.76g
50.82g
N/A
Sugar
0.98g
1.45g
N/A
Sodium
2mg
4mg
0%
Vitamin A
1µg
0µg
0%
Choline
30.4mg
32.2mg
0%
Tryptophan
0.108mg
0.335mg
0%
Threonine
0.289mg
0.502mg
0%
Isoleucine
0.208mg
0.668mg
0%
Leucine
0.563mg
1.374mg
0%
Lysine
0.286mg
0.76mg
0%
Methionine
0.153mg
0.335mg
0%
Phenylalanine
0.435mg
0.908mg
0%
Valine
0.317mg
0.964mg
0%
Histidine
0.189mg
0.41mg
0%
Fructose
0.11g
0%
Macronutrient Comparison
Macronutrient breakdown side-by-side comparison
2
10%
76%
11%
Protein:
10.34 g
Fats:
1.63 g
Carbs:
75.86 g
Water:
10.6 g
Other:
1.57 g
3
17%
7%
66%
7%
3%
Protein:
17.3 g
Fats:
7.03 g
Carbs:
66.22 g
Water:
6.55 g
Other:
2.9 g
Contains
more
Carbs Carbs
+14.6%
Contains
more
Water Water
+61.8%
Contains
more
Protein Protein
+67.3%
Contains
more
Fats Fats
+331.3%
Contains
more
Other Other
+84.7%
Fat Type Comparison
Fat type breakdown side-by-side comparison
1
17%
18%
65%
Saturated fat:
Sat. Fat
0.197 g
Monounsaturated fat:
Mono. Fat
0.208 g
Polyunsaturated fat:
Poly. Fat
0.767 g
2
21%
37%
43%
Saturated fat:
Sat. Fat
1.328 g
Monounsaturated fat:
Mono. Fat
2.376 g
Polyunsaturated fat:
Poly. Fat
2.766 g
Contains
less
Sat. Fat Saturated fat
-85.2%
Contains
more
Mono. Fat Monounsaturated fat
+1042.3%
Contains
more
Poly. Fat Polyunsaturated fat
+260.6%