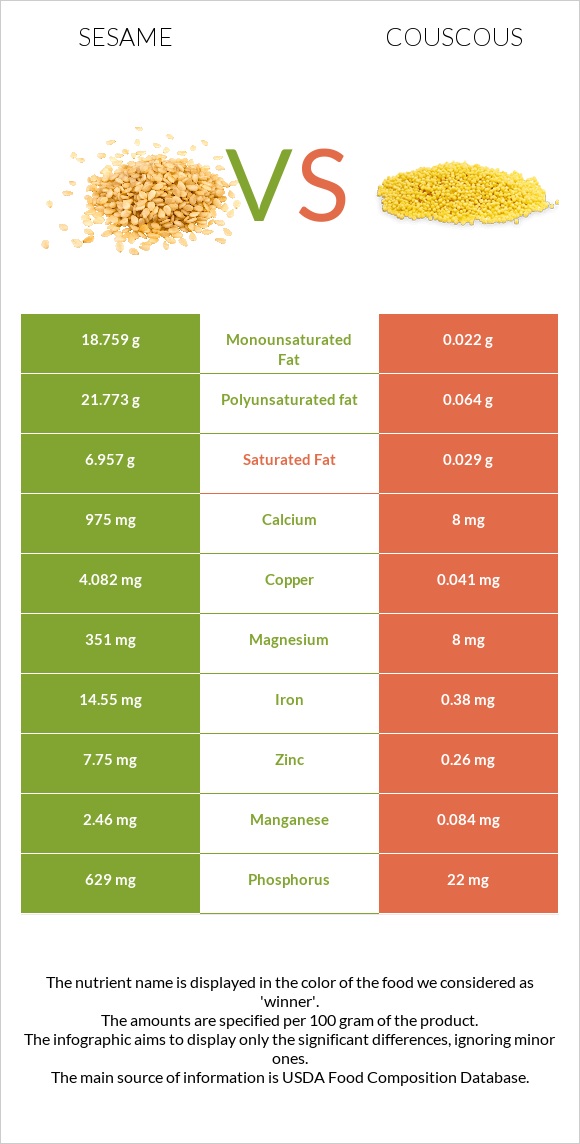
Important differences between sesame and couscous Couscous has less copper, iron, manganese, calcium, phosphorus, magnesium, zinc, vitamin B1, vitamin B6, and fiber. Sesame's daily need coverage for copper is 449% more. Sesame has 122 times more calcium than couscous. Sesame has 975mg of calcium, while couscous has 8mg. The food varieties used in the comparison are Seeds, sesame seeds, whole, dried and Couscous, cooked .
Infographic
Mineral Comparison
Mineral comparison score is based on the number of minerals by which one or the other food is richer. The "coverage" charts below show how much of the daily needs can be covered by 300 grams of the food.
9
100 g
300 g
1 tbsp - 9g 1 cup - 144g
Magnesium
Magnesium
Calcium
Calcium
Potassium
Potassium
Iron
Iron
Copper
Copper
Zinc
Zinc
Phosphorus
Phosphorus
Sodium
Sodium
Manganese
Manganese
Selenium
Selenium
251%
293%
41%
546%
1361%
211%
270%
1.4%
321%
188%
1
100 g
300 g
1 oz, dry, yields - 86g 1 cup, cooked - 157g 1 cup, dry, yields - 528g
Magnesium
Magnesium
Calcium
Calcium
Potassium
Potassium
Iron
Iron
Copper
Copper
Zinc
Zinc
Phosphorus
Phosphorus
Sodium
Sodium
Manganese
Manganese
Selenium
Selenium
5.7%
2.4%
5.1%
14%
14%
7.1%
9.4%
0.65%
11%
150%
Vitamin Comparison
Vitamin comparison score is based on the number of vitamins by which one or the other food is richer. The "coverage" charts below show how much of the daily needs can be covered by 300 grams of the food.
6
100 g
300 g
1 tbsp - 9g 1 cup - 144g
Vitamin C
Vit. C
Vitamin D
Vit. D
Vitamin A
Vit. A
Vitamin E
Vit. E
Vitamin B1
Vit. B1
Vitamin B2
Vit. B2
Vitamin B3
Vit. B3
Vitamin B5
Vit. B5
Vitamin B6
Vit. B6
Vitamin B12
Vit. B12
Vitamin K
Vit. K
Folate
Folate
0%
0%
0%
5%
198%
57%
85%
3%
182%
0%
0%
73%
2
100 g
300 g
1 oz, dry, yields - 86g 1 cup, cooked - 157g 1 cup, dry, yields - 528g
Vitamin C
Vit. C
Vitamin D
Vit. D
Vitamin A
Vit. A
Vitamin E
Vit. E
Vitamin B1
Vit. B1
Vitamin B2
Vit. B2
Vitamin B3
Vit. B3
Vitamin B5
Vit. B5
Vitamin B6
Vit. B6
Vitamin B12
Vit. B12
Vitamin K
Vit. K
Folate
Folate
0%
0%
0%
2.6%
16%
6.2%
18%
22%
12%
0%
0.25%
11%
All nutrients comparison - raw data values
Nutrient
DV% diff.
Copper
4.082mg
0.041mg
449%
Iron
14.55mg
0.38mg
177%
Polyunsaturated fat
21.773g
0.064g
145%
Manganese
2.46mg
0.084mg
103%
Calcium
975mg
8mg
97%
Phosphorus
629mg
22mg
87%
Magnesium
351mg
8mg
82%
Fats
49.67g
0.16g
76%
Zinc
7.75mg
0.26mg
68%
Vitamin B1
0.791mg
0.063mg
61%
Vitamin B6
0.79mg
0.051mg
57%
Monounsaturated fat
18.759g
0.022g
47%
Fiber
11.8g
1.4g
42%
Saturated fat
6.957g
0.029g
31%
Protein
17.73g
3.79g
28%
Calories
573kcal
112kcal
23%
Vitamin B3
4.515mg
0.983mg
22%
Folate
97µg
15µg
21%
Vitamin B2
0.247mg
0.027mg
17%
Selenium
34.4µg
27.5µg
13%
Potassium
468mg
58mg
12%
Vitamin B5
0.05mg
0.371mg
6%
Choline
25.6mg
3.3mg
4%
Vitamin E
0.25mg
0.13mg
1%
Protein per 100 calories
3.1g
3.4g
N/A
Calories per 10 g protein
323kcal
296kcal
N/A
Weight per 100 calories
17g
89g
N/A
Unsaturated / Saturated Fat ratio
5.8
3
N/A
Net carbs
11.65g
21.82g
N/A
Carbs
23.45g
23.22g
0%
Sugar
0.3g
0.1g
N/A
Sodium
11mg
5mg
0%
Vitamin K
0µg
0.1µg
0%
Tryptophan
0.388mg
0.049mg
0%
Threonine
0.736mg
0.1mg
0%
Isoleucine
0.763mg
0.147mg
0%
Leucine
1.358mg
0.259mg
0%
Lysine
0.569mg
0.073mg
0%
Methionine
0.586mg
0.059mg
0%
Phenylalanine
0.94mg
0.184mg
0%
Valine
0.99mg
0.162mg
0%
Histidine
0.522mg
0.077mg
0%
Macronutrient Comparison
Macronutrient breakdown side-by-side comparison
4
18%
50%
23%
5%
4%
Protein:
17.73 g
Fats:
49.67 g
Carbs:
23.45 g
Water:
4.69 g
Other:
4.46 g
1
4%
23%
73%
Protein:
3.79 g
Fats:
0.16 g
Carbs:
23.22 g
Water:
72.57 g
Other:
0.26 g
Contains
more
Protein Protein
+367.8%
Contains
more
Fats Fats
+30943.8%
Contains
more
Other Other
+1615.4%
Contains
more
Water Water
+1447.3%
Fat Type Comparison
Fat type breakdown side-by-side comparison
2
15%
40%
46%
Saturated fat:
Sat. Fat
6.957 g
Monounsaturated fat:
Mono. Fat
18.759 g
Polyunsaturated fat:
Poly. Fat
21.773 g
1
25%
19%
56%
Saturated fat:
Sat. Fat
0.029 g
Monounsaturated fat:
Mono. Fat
0.022 g
Polyunsaturated fat:
Poly. Fat
0.064 g
Contains
more
Mono. Fat Monounsaturated fat
+85168.2%
Contains
more
Poly. Fat Polyunsaturated fat
+33920.3%
Contains
less
Sat. Fat Saturated fat
-99.6%