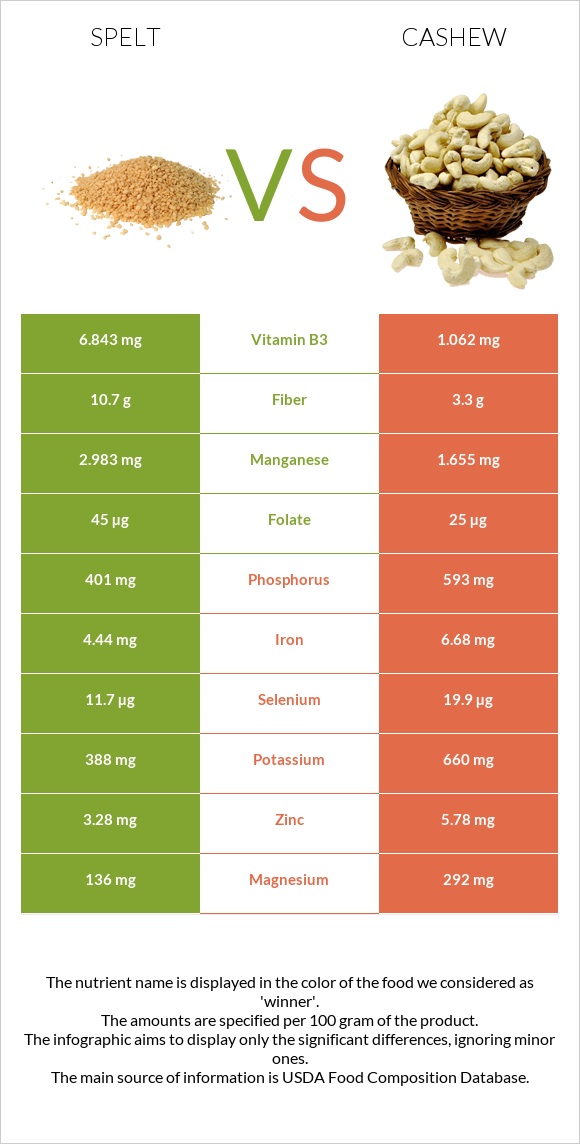
What are the differences between spelt and cashew? Spelt is higher in manganese, vitamin B3, and fiber, yet cashew is higher in copper, magnesium, iron, phosphorus, vitamin K, and zinc. Cashew's daily need coverage for copper is 187% more. Spelt has 6 times more vitamin B3 than cashew. While spelt has 6.843mg of vitamin B3, cashew has only 1.062mg. The amount of saturated fat in spelt is lower. The glycemic index of cashew is lower. We used Spelt, uncooked and Nuts, cashew nuts, raw types in this article.
Infographic
Mineral Comparison
Mineral comparison score is based on the number of minerals by which one or the other food is richer. The "coverage" charts below show how much of the daily needs can be covered by 300 grams of the food.
2
100 g
300 g
1 cup - 174g
Magnesium
Magnesium
Calcium
Calcium
Potassium
Potassium
Iron
Iron
Copper
Copper
Zinc
Zinc
Phosphorus
Phosphorus
Sodium
Sodium
Manganese
Manganese
Selenium
Selenium
97%
8.1%
34%
167%
170%
89%
172%
1%
389%
64%
8
100 g
300 g
1 oz - 28.35g
Magnesium
Magnesium
Calcium
Calcium
Potassium
Potassium
Iron
Iron
Copper
Copper
Zinc
Zinc
Phosphorus
Phosphorus
Sodium
Sodium
Manganese
Manganese
Selenium
Selenium
209%
11%
58%
251%
732%
158%
254%
1.6%
216%
109%
Vitamin Comparison
Vitamin comparison score is based on the number of vitamins by which one or the other food is richer. The "coverage" charts below show how much of the daily needs can be covered by 300 grams of the food.
4
100 g
300 g
1 cup - 174g
Vitamin C
Vit. C
Vitamin D
Vit. D
Vitamin A
Vit. A
Vitamin E
Vit. E
Vitamin B1
Vit. B1
Vitamin B2
Vit. B2
Vitamin B3
Vit. B3
Vitamin B5
Vit. B5
Vitamin B6
Vit. B6
Vitamin B12
Vit. B12
Vitamin K
Vit. K
Folate
Folate
0%
0%
0%
16%
91%
26%
128%
64%
53%
0%
9%
34%
5
100 g
300 g
1 oz - 28.35g
Vitamin C
Vit. C
Vitamin D
Vit. D
Vitamin A
Vit. A
Vitamin E
Vit. E
Vitamin B1
Vit. B1
Vitamin B2
Vit. B2
Vitamin B3
Vit. B3
Vitamin B5
Vit. B5
Vitamin B6
Vit. B6
Vitamin B12
Vit. B12
Vitamin K
Vit. K
Folate
Folate
1.7%
0%
0%
18%
106%
13%
20%
52%
96%
0%
85%
19%
All nutrients comparison - raw data values
Nutrient
DV% diff.
Copper
0.511mg
2.195mg
187%
Fats
2.43g
43.85g
64%
Manganese
2.983mg
1.655mg
58%
Monounsaturated fat
0.445g
23.797g
58%
Polyunsaturated fat
1.258g
7.845g
44%
Magnesium
136mg
292mg
37%
Vitamin B3
6.843mg
1.062mg
36%
Saturated fat
0.406g
7.783g
34%
Fiber
10.7g
3.3g
30%
Iron
4.44mg
6.68mg
28%
Phosphorus
401mg
593mg
27%
Vitamin K
3.6µg
34.1µg
25%
Zinc
3.28mg
5.78mg
23%
Selenium
11.7µg
19.9µg
15%
Vitamin B6
0.23mg
0.417mg
14%
Carbs
70.19g
30.19g
13%
Starch
53.92g
23.49g
13%
Calories
338kcal
553kcal
11%
Potassium
388mg
660mg
8%
Protein
14.57g
18.22g
7%
Vitamin B1
0.364mg
0.423mg
5%
Folate
45µg
25µg
5%
Vitamin B2
0.113mg
0.058mg
4%
Vitamin B5
1.068mg
0.864mg
4%
Vitamin C
0mg
0.5mg
1%
Calcium
27mg
37mg
1%
Vitamin E
0.79mg
0.9mg
1%
Protein per 100 calories
4.3g
3.3g
N/A
Calories per 10 g protein
232kcal
304kcal
N/A
Weight per 100 calories
30g
18g
N/A
Unsaturated / Saturated Fat ratio
4.2
4.1
N/A
Net carbs
59.49g
26.89g
N/A
Sugar
6.82g
5.91g
N/A
Sodium
8mg
12mg
0%
Tryptophan
0.132mg
0.287mg
0%
Threonine
0.443mg
0.688mg
0%
Isoleucine
0.552mg
0.789mg
0%
Leucine
1.07mg
1.472mg
0%
Lysine
0.409mg
0.928mg
0%
Methionine
0.258mg
0.362mg
0%
Phenylalanine
0.737mg
0.951mg
0%
Valine
0.681mg
1.094mg
0%
Histidine
0.36mg
0.456mg
0%
Fructose
0.24g
0.05g
0%
Omega-3 - ALA
0.065g
N/A
Macronutrient Comparison
Macronutrient breakdown side-by-side comparison
2
15%
2%
70%
11%
2%
Protein:
14.57 g
Fats:
2.43 g
Carbs:
70.19 g
Water:
11.02 g
Other:
1.79 g
3
18%
44%
30%
5%
3%
Protein:
18.22 g
Fats:
43.85 g
Carbs:
30.19 g
Water:
5.2 g
Other:
2.54 g
Contains
more
Carbs Carbs
+132.5%
Contains
more
Water Water
+111.9%
Contains
more
Protein Protein
+25.1%
Contains
more
Fats Fats
+1704.5%
Contains
more
Other Other
+41.9%
Fat Type Comparison
Fat type breakdown side-by-side comparison
1
19%
21%
60%
Saturated fat:
Sat. Fat
0.406 g
Monounsaturated fat:
Mono. Fat
0.445 g
Polyunsaturated fat:
Poly. Fat
1.258 g
2
20%
60%
20%
Saturated fat:
Sat. Fat
7.783 g
Monounsaturated fat:
Mono. Fat
23.797 g
Polyunsaturated fat:
Poly. Fat
7.845 g
Contains
less
Sat. Fat Saturated fat
-94.8%
Contains
more
Mono. Fat Monounsaturated fat
+5247.6%
Contains
more
Poly. Fat Polyunsaturated fat
+523.6%
Carbohydrate type comparison
Carbohydrate type breakdown side-by-side comparison
4
89%
8%
Starch:
53.92 g
Sucrose:
0.59 g
Glucose:
0.84 g
Fructose:
0.24 g
Lactose:
0 g
Maltose:
5.15 g
Galactose:
0 g
1
80%
20%
Starch:
23.49 g
Sucrose:
5.81 g
Glucose:
0.05 g
Fructose:
0.05 g
Lactose:
0 g
Maltose:
0 g
Galactose:
0 g
Contains
more
Starch Starch
+129.5%
Contains
more
Glucose Glucose
+1580%
Contains
more
Fructose Fructose
+380%
Contains
more
Maltose Maltose
+∞%
Contains
more
Sucrose Sucrose
+884.7%
~equal in
Lactose
~0g
~equal in
Galactose
~0g