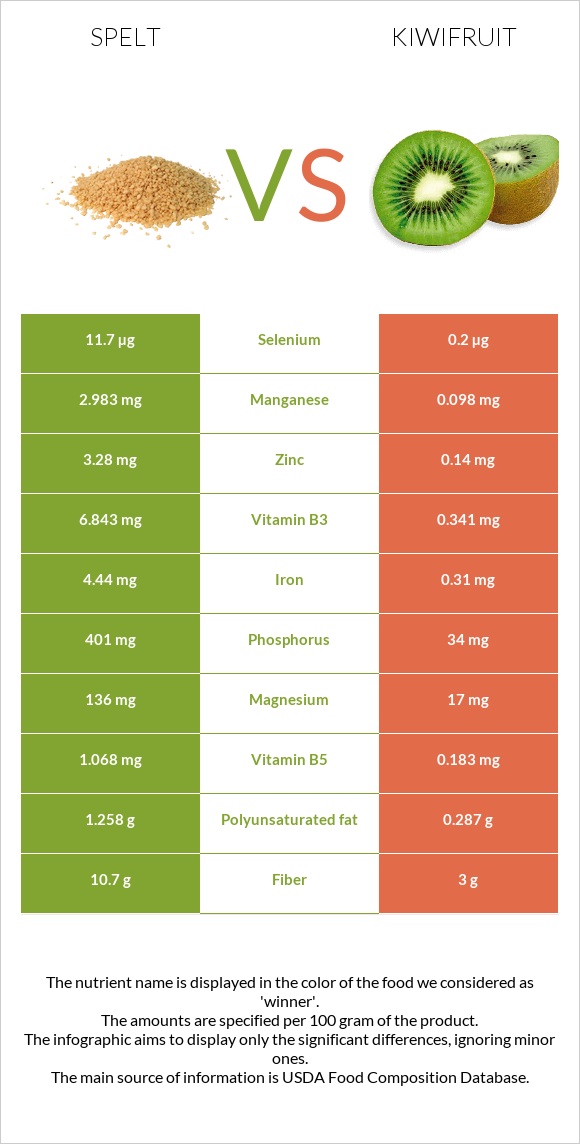
How are spelt and kiwi different? Spelt is richer in manganese, phosphorus, iron, copper, vitamin B3, fiber, zinc, and magnesium, while kiwi is higher in vitamin C and vitamin K. Spelt covers your daily need for manganese, 125% more than kiwi. Spelt contains 23 times more zinc than kiwi. Spelt contains 3.28mg of zinc, while kiwi contains 0.14mg. Spelt, uncooked and Kiwifruit, green, raw types were used in this article.
Infographic
Mineral Comparison
Mineral comparison score is based on the number of minerals by which one or the other food is richer. The "coverage" charts below show how much of the daily needs can be covered by 300 grams of the food.
8
100 g
300 g
1 cup - 174g
Magnesium
Magnesium
Calcium
Calcium
Potassium
Potassium
Iron
Iron
Copper
Copper
Zinc
Zinc
Phosphorus
Phosphorus
Sodium
Sodium
Manganese
Manganese
Selenium
Selenium
97%
8.1%
34%
167%
170%
89%
172%
1%
389%
64%
2
100 g
300 g
1 fruit (2" dia) - 69g 1 NLEA serving - 148g 1 cup, sliced - 180g
Magnesium
Magnesium
Calcium
Calcium
Potassium
Potassium
Iron
Iron
Copper
Copper
Zinc
Zinc
Phosphorus
Phosphorus
Sodium
Sodium
Manganese
Manganese
Selenium
Selenium
12%
10%
28%
12%
43%
3.8%
15%
0.39%
13%
1.1%
Vitamin Comparison
Vitamin comparison score is based on the number of vitamins by which one or the other food is richer. The "coverage" charts below show how much of the daily needs can be covered by 300 grams of the food.
6
100 g
300 g
1 cup - 174g
Vitamin C
Vit. C
Vitamin D
Vit. D
Vitamin A
Vit. A
Vitamin E
Vit. E
Vitamin B1
Vit. B1
Vitamin B2
Vit. B2
Vitamin B3
Vit. B3
Vitamin B5
Vit. B5
Vitamin B6
Vit. B6
Vitamin B12
Vit. B12
Vitamin K
Vit. K
Folate
Folate
0%
0%
0%
16%
91%
26%
128%
64%
53%
0%
9%
34%
4
100 g
300 g
1 fruit (2" dia) - 69g 1 NLEA serving - 148g 1 cup, sliced - 180g
Vitamin C
Vit. C
Vitamin D
Vit. D
Vitamin A
Vit. A
Vitamin E
Vit. E
Vitamin B1
Vit. B1
Vitamin B2
Vit. B2
Vitamin B3
Vit. B3
Vitamin B5
Vit. B5
Vitamin B6
Vit. B6
Vitamin B12
Vit. B12
Vitamin K
Vit. K
Folate
Folate
309%
0%
1.3%
29%
6.8%
5.8%
6.4%
11%
15%
0%
101%
19%
All nutrients comparison - raw data values
Nutrient
DV% diff.
Manganese
2.983mg
0.098mg
125%
Vitamin C
0mg
92.7mg
103%
Iron
4.44mg
0.31mg
52%
Phosphorus
401mg
34mg
52%
Copper
0.511mg
0.13mg
42%
Vitamin B3
6.843mg
0.341mg
41%
Fiber
10.7g
3g
31%
Vitamin K
3.6µg
40.3µg
31%
Zinc
3.28mg
0.14mg
29%
Magnesium
136mg
17mg
28%
Vitamin B1
0.364mg
0.027mg
28%
Protein
14.57g
1.14g
27%
Starch
53.92g
0g
22%
Selenium
11.7µg
0.2µg
21%
Carbs
70.19g
14.66g
19%
Vitamin B5
1.068mg
0.183mg
18%
Calories
338kcal
61kcal
14%
Vitamin B6
0.23mg
0.063mg
13%
Vitamin B2
0.113mg
0.025mg
7%
Polyunsaturated fat
1.258g
0.287g
6%
Folate
45µg
25µg
5%
Fructose
0.24g
4.35g
5%
Vitamin E
0.79mg
1.46mg
4%
Fats
2.43g
0.52g
3%
Potassium
388mg
312mg
2%
Saturated fat
0.406g
0.029g
2%
Calcium
27mg
34mg
1%
Choline
7.8mg
1%
Monounsaturated fat
0.445g
0.047g
1%
Protein per 100 calories
4.3g
1.9g
N/A
Calories per 10 g protein
232kcal
535kcal
N/A
Weight per 100 calories
30g
164g
N/A
Unsaturated / Saturated Fat ratio
4.2
12
N/A
Net carbs
59.49g
11.66g
N/A
Sugar
6.82g
8.99g
N/A
Sodium
8mg
3mg
0%
Vitamin A
0µg
4µg
0%
Tryptophan
0.132mg
0.015mg
0%
Threonine
0.443mg
0.047mg
0%
Isoleucine
0.552mg
0.051mg
0%
Leucine
1.07mg
0.066mg
0%
Lysine
0.409mg
0.061mg
0%
Methionine
0.258mg
0.024mg
0%
Phenylalanine
0.737mg
0.044mg
0%
Valine
0.681mg
0.057mg
0%
Histidine
0.36mg
0.027mg
0%
Omega-3 - ALA
0.065g
N/A
Macronutrient Comparison
Macronutrient breakdown side-by-side comparison
4
15%
2%
70%
11%
2%
Protein:
14.57 g
Fats:
2.43 g
Carbs:
70.19 g
Water:
11.02 g
Other:
1.79 g
1
15%
83%
Protein:
1.14 g
Fats:
0.52 g
Carbs:
14.66 g
Water:
83.07 g
Other:
0.61 g
Contains
more
Protein Protein
+1178.1%
Contains
more
Fats Fats
+367.3%
Contains
more
Carbs Carbs
+378.8%
Contains
more
Other Other
+193.4%
Contains
more
Water Water
+653.8%
Fat Type Comparison
Fat type breakdown side-by-side comparison
2
19%
21%
60%
Saturated fat:
Sat. Fat
0.406 g
Monounsaturated fat:
Mono. Fat
0.445 g
Polyunsaturated fat:
Poly. Fat
1.258 g
1
8%
13%
79%
Saturated fat:
Sat. Fat
0.029 g
Monounsaturated fat:
Mono. Fat
0.047 g
Polyunsaturated fat:
Poly. Fat
0.287 g
Contains
more
Mono. Fat Monounsaturated fat
+846.8%
Contains
more
Poly. Fat Polyunsaturated fat
+338.3%
Contains
less
Sat. Fat Saturated fat
-92.9%
Carbohydrate type comparison
Carbohydrate type breakdown side-by-side comparison
3
89%
8%
Starch:
53.92 g
Sucrose:
0.59 g
Glucose:
0.84 g
Fructose:
0.24 g
Lactose:
0 g
Maltose:
5.15 g
Galactose:
0 g
3
2%
46%
48%
2%
2%
Starch:
0 g
Sucrose:
0.15 g
Glucose:
4.11 g
Fructose:
4.35 g
Lactose:
0 g
Maltose:
0.19 g
Galactose:
0.17 g
Contains
more
Starch Starch
+∞%
Contains
more
Sucrose Sucrose
+293.3%
Contains
more
Maltose Maltose
+2610.5%
Contains
more
Glucose Glucose
+389.3%
Contains
more
Fructose Fructose
+1712.5%
Contains
more
Galactose Galactose
+∞%