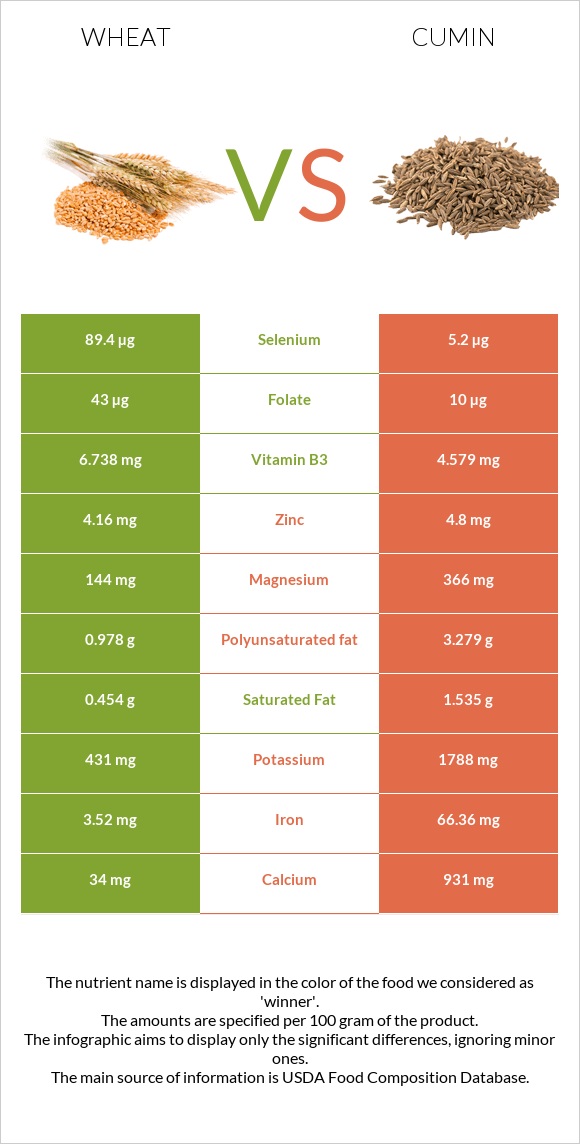
Significant differences between wheat and cumin Wheat has more selenium; however, cumin is richer in iron, calcium, magnesium, potassium, copper, vitamin A, vitamin B1, vitamin B2, and manganese. Cumin covers your daily iron needs 786% more than wheat . Cumin has 17 times less selenium than wheat . Wheat has 89.4µg of selenium, while cumin has 5.2µg. Wheat has a higher glycemic index. The glycemic index of wheat is 50, while the glycemic index of cumin is 0. Specific food types used in this comparison are Wheat, durum and Spices, cumin seed .
Infographic
Mineral Comparison
Mineral comparison score is based on the number of minerals by which one or the other food is richer. The "coverage" charts below show how much of the daily needs can be covered by 300 grams of the food.
2
100 g
300 g
1 cup - 192g
Magnesium
Magnesium
Calcium
Calcium
Potassium
Potassium
Iron
Iron
Copper
Copper
Zinc
Zinc
Phosphorus
Phosphorus
Sodium
Sodium
Manganese
Manganese
Selenium
Selenium
103%
10%
38%
132%
184%
113%
218%
0.26%
393%
488%
7
100 g
300 g
0.25 tsp, whole - 0.5g 1 tbsp, whole - 6g
Magnesium
Magnesium
Calcium
Calcium
Potassium
Potassium
Iron
Iron
Copper
Copper
Zinc
Zinc
Phosphorus
Phosphorus
Sodium
Sodium
Manganese
Manganese
Selenium
Selenium
261%
279%
158%
2489%
289%
131%
214%
22%
435%
28%
Vitamin Comparison
Vitamin comparison score is based on the number of vitamins by which one or the other food is richer. The "coverage" charts below show how much of the daily needs can be covered by 300 grams of the food.
3
100 g
300 g
1 cup - 192g
Vitamin C
Vit. C
Vitamin D
Vit. D
Vitamin A
Vit. A
Vitamin E
Vit. E
Vitamin B1
Vit. B1
Vitamin B2
Vit. B2
Vitamin B3
Vit. B3
Vitamin B5
Vit. B5
Vitamin B6
Vit. B6
Vitamin B12
Vit. B12
Vitamin K
Vit. K
Folate
Folate
0%
0%
0%
0%
105%
28%
126%
56%
97%
0%
0%
32%
6
100 g
300 g
0.25 tsp, whole - 0.5g 1 tbsp, whole - 6g
Vitamin C
Vit. C
Vitamin D
Vit. D
Vitamin A
Vit. A
Vitamin E
Vit. E
Vitamin B1
Vit. B1
Vitamin B2
Vit. B2
Vitamin B3
Vit. B3
Vitamin B5
Vit. B5
Vitamin B6
Vit. B6
Vitamin B12
Vit. B12
Vitamin K
Vit. K
Folate
Folate
26%
0%
21%
67%
157%
75%
86%
0%
100%
0%
14%
7.5%
All nutrients comparison - raw data values
Nutrient
DV% diff.
Iron
3.52mg
66.36mg
786%
Selenium
89.4µg
5.2µg
153%
Calcium
34mg
931mg
90%
Magnesium
144mg
366mg
53%
Fiber
10.5g
42%
Potassium
431mg
1788mg
40%
Copper
0.553mg
0.867mg
35%
Monounsaturated fat
0.344g
14.04g
34%
Fats
2.47g
22.27g
30%
Vitamin E
3.33mg
22%
Vitamin B5
0.935mg
19%
Vitamin B1
0.419mg
0.628mg
17%
Vitamin B2
0.121mg
0.327mg
16%
Polyunsaturated fat
0.978g
3.279g
15%
Manganese
3.012mg
3.333mg
14%
Vitamin B3
6.738mg
4.579mg
13%
Vitamin C
0mg
7.7mg
9%
Carbs
71.13g
44.24g
9%
Protein
13.68g
17.81g
8%
Folate
43µg
10µg
8%
Sodium
2mg
168mg
7%
Vitamin A
0µg
64µg
7%
Zinc
4.16mg
4.8mg
6%
Vitamin K
5.4µg
5%
Saturated fat
0.454g
1.535g
5%
Choline
24.7mg
4%
Calories
339kcal
375kcal
2%
Phosphorus
508mg
499mg
1%
Vitamin B6
0.419mg
0.435mg
1%
Protein per 100 calories
4g
4.7g
N/A
Calories per 10 g protein
248kcal
211kcal
N/A
Weight per 100 calories
29g
27g
N/A
Unsaturated / Saturated Fat ratio
2.9
11
N/A
Net carbs
71.13g
33.74g
N/A
Sugar
2.25g
N/A
Tryptophan
0.176mg
0%
Threonine
0.366mg
0%
Isoleucine
0.533mg
0%
Leucine
0.934mg
0%
Lysine
0.303mg
0%
Methionine
0.221mg
0%
Phenylalanine
0.681mg
0%
Valine
0.594mg
0%
Histidine
0.322mg
0%
Macronutrient Comparison
Macronutrient breakdown side-by-side comparison
2
14%
2%
71%
11%
2%
Protein:
13.68 g
Fats:
2.47 g
Carbs:
71.13 g
Water:
10.94 g
Other:
1.78 g
3
18%
22%
44%
8%
8%
Protein:
17.81 g
Fats:
22.27 g
Carbs:
44.24 g
Water:
8.06 g
Other:
7.62 g
Contains
more
Carbs Carbs
+60.8%
Contains
more
Water Water
+35.7%
Contains
more
Protein Protein
+30.2%
Contains
more
Fats Fats
+801.6%
Contains
more
Other Other
+328.1%
Fat Type Comparison
Fat type breakdown side-by-side comparison
1
26%
19%
55%
Saturated fat:
Sat. Fat
0.454 g
Monounsaturated fat:
Mono. Fat
0.344 g
Polyunsaturated fat:
Poly. Fat
0.978 g
2
8%
74%
17%
Saturated fat:
Sat. Fat
1.535 g
Monounsaturated fat:
Mono. Fat
14.04 g
Polyunsaturated fat:
Poly. Fat
3.279 g
Contains
less
Sat. Fat Saturated fat
-70.4%
Contains
more
Mono. Fat Monounsaturated fat
+3981.4%
Contains
more
Poly. Fat Polyunsaturated fat
+235.3%