
Сравнить продукты Соус тако и соус пикантный
Сравнить
Инфографика
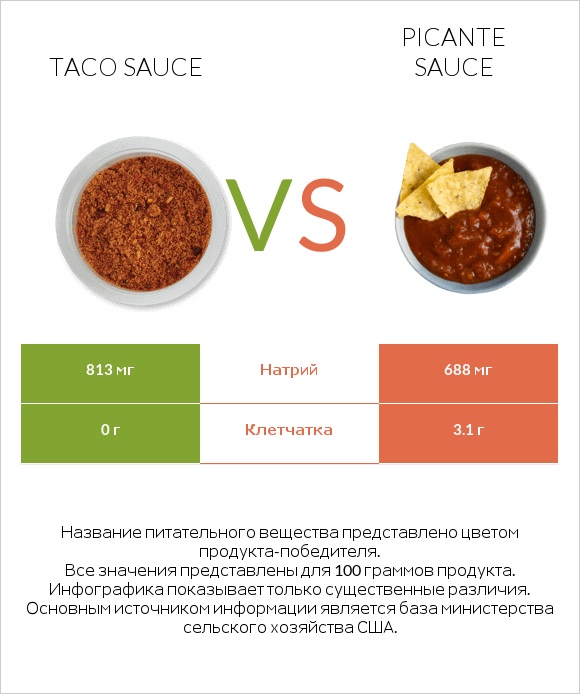
Infographic link
Сравнение минералов
The mineral comparison score is based on which food has a more favorable amount of each mineral. The �coverage� charts below show how much of the daily mineral needs are covered by the selected amount of each food.
| Содержит меньше НатрийНатрий | -15.4% |
Сравнение витаминов
The vitamin comparison score is based on the number of vitamins in which one food is richer than the other. The �coverage� charts below show how much of the daily vitamin needs are covered by the selected amount of each food.
Таблица сравнения всех элементов
| Nutrient |  |
 |
DV% diff. |
| Клетчатка | 0g | 3.1g | 12% |
| Натрий | 813mg | 688mg | 5% |
| Углеводы | 12.5g | 6.25g | 2% |
| Калорийность | 50kcal | 25kcal | 1% |
| Вес 100 калорий | 200g | 400g | N/A |
| Чистые углеводы | 12.5g | 3.15g | N/A |
| Сахар | 6.25g | 6.25g | N/A |
Macronutrient Comparison
Macronutrient breakdown side-by-side comparison
Белки:
0 г
Жиры:
0 г
Углеводы:
12.5 г
Вода:
85.3 г
Другое:
2.2 г
Белки:
0 г
Жиры:
0 г
Углеводы:
6.25 г
Вода:
89.3 г
Другое:
4.45 г
| Содержит больше УглеводыУглеводы | +100% |
Одинаковое количество вещества
Белки
~0g
Одинаковое количество вещества
Жиры
~0g
Одинаковое количество вещества
Вода
~89.3g


