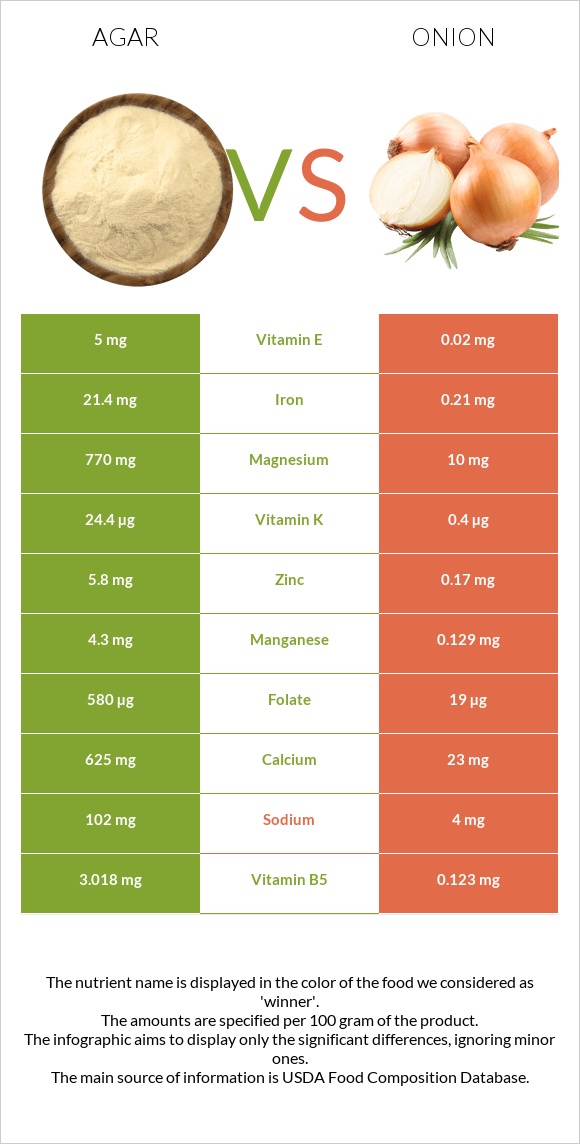
A recap on the differences between agar and onions Onions have less iron, manganese, magnesium, folate, copper, calcium, vitamin B5, zinc, vitamin E, and potassium. Agar covers your daily iron needs 265% more than onions. Onions contain 250 times less vitamin E than agar. Agar contains 5mg of vitamin E, while onions contain 0.02mg. Food varieties used in this article are Seaweed, agar, dried and Onions, raw .
Infographic
Mineral Comparison
Mineral comparison score is based on the number of minerals by which one or the other food is richer. The "coverage" charts below show how much of the daily needs can be covered by 300 grams of the food.
9
100 g
300 g
Magnesium
Magnesium
Calcium
Calcium
Potassium
Potassium
Iron
Iron
Copper
Copper
Zinc
Zinc
Phosphorus
Phosphorus
Sodium
Sodium
Manganese
Manganese
Selenium
Selenium
550%
188%
99%
803%
203%
158%
22%
13%
561%
40%
1
100 g
300 g
1 slice, thin - 9g 1 tbsp chopped - 10g 1 slice, medium (1/8" thick) - 14g 1 slice, large (1/4" thick) - 38g 10 rings - 60g 1 small - 70g 1 medium (2-1/2" dia) - 110g 1 cup, sliced - 115g 1 large - 150g 1 cup, chopped - 160g
Magnesium
Magnesium
Calcium
Calcium
Potassium
Potassium
Iron
Iron
Copper
Copper
Zinc
Zinc
Phosphorus
Phosphorus
Sodium
Sodium
Manganese
Manganese
Selenium
Selenium
7.1%
6.9%
13%
7.9%
13%
4.6%
12%
0.52%
17%
2.7%
Vitamin Comparison
Vitamin comparison score is based on the number of vitamins by which one or the other food is richer. The "coverage" charts below show how much of the daily needs can be covered by 300 grams of the food.
7
100 g
300 g
Vitamin C
Vit. C
Vitamin D
Vit. D
Vitamin A
Vit. A
Vitamin E
Vit. E
Vitamin B1
Vit. B1
Vitamin B2
Vit. B2
Vitamin B3
Vit. B3
Vitamin B5
Vit. B5
Vitamin B6
Vit. B6
Vitamin B12
Vit. B12
Vitamin K
Vit. K
Folate
Folate
0%
0%
0%
100%
2.5%
51%
3.8%
181%
70%
0%
61%
435%
2
100 g
300 g
1 slice, thin - 9g 1 tbsp chopped - 10g 1 slice, medium (1/8" thick) - 14g 1 slice, large (1/4" thick) - 38g 10 rings - 60g 1 small - 70g 1 medium (2-1/2" dia) - 110g 1 cup, sliced - 115g 1 large - 150g 1 cup, chopped - 160g
Vitamin C
Vit. C
Vitamin D
Vit. D
Vitamin A
Vit. A
Vitamin E
Vit. E
Vitamin B1
Vit. B1
Vitamin B2
Vit. B2
Vitamin B3
Vit. B3
Vitamin B5
Vit. B5
Vitamin B6
Vit. B6
Vitamin B12
Vit. B12
Vitamin K
Vit. K
Folate
Folate
25%
0%
0%
0.4%
12%
6.2%
2.2%
7.4%
28%
0%
1%
14%
All nutrients comparison - raw data values
Nutrient
DV% diff.
Iron
21.4mg
0.21mg
265%
Magnesium
770mg
10mg
181%
Manganese
4.3mg
0.129mg
181%
Folate
580µg
19µg
140%
Copper
0.61mg
0.039mg
63%
Calcium
625mg
23mg
60%
Vitamin B5
3.018mg
0.123mg
58%
Zinc
5.8mg
0.17mg
51%
Vitamin E
5mg
0.02mg
33%
Potassium
1125mg
146mg
29%
Carbs
80.88g
9.34g
24%
Fiber
7.7g
1.7g
24%
Vitamin K
24.4µg
0.4µg
20%
Vitamin B2
0.222mg
0.027mg
15%
Vitamin B6
0.303mg
0.12mg
14%
Calories
306kcal
40kcal
13%
Selenium
7.4µg
0.5µg
13%
Protein
6.21g
1.1g
10%
Choline
63.3mg
6.1mg
10%
Vitamin C
0mg
7.4mg
8%
Sodium
102mg
4mg
4%
Phosphorus
52mg
29mg
3%
Vitamin B1
0.01mg
0.046mg
3%
Fructose
1.29g
2%
Vitamin B3
0.202mg
0.116mg
1%
Polyunsaturated fat
0.102g
0.017g
1%
Protein per 100 calories
2g
2.8g
N/A
Calories per 10 g protein
493kcal
364kcal
N/A
Weight per 100 calories
33g
250g
N/A
Fats
0.3g
0.1g
0%
Net carbs
73.18g
7.64g
N/A
Sugar
2.97g
4.24g
N/A
Saturated fat
0.061g
0.042g
0%
Monounsaturated fat
0.027g
0.013g
0%
Tryptophan
0.014mg
0%
Threonine
0.021mg
0%
Isoleucine
0.014mg
0%
Leucine
0.025mg
0%
Lysine
0.039mg
0%
Methionine
0.002mg
0%
Phenylalanine
0.025mg
0%
Valine
0.021mg
0%
Histidine
0.014mg
0%
Omega-3 - EPA
0.087g
0g
N/A
Macronutrient Comparison
Macronutrient breakdown side-by-side comparison
4
6%
81%
9%
4%
Protein:
6.21 g
Fats:
0.3 g
Carbs:
80.88 g
Water:
8.68 g
Other:
3.93 g
1
9%
89%
Protein:
1.1 g
Fats:
0.1 g
Carbs:
9.34 g
Water:
89.11 g
Other:
0.35 g
Contains
more
Protein Protein
+464.5%
Contains
more
Fats Fats
+200%
Contains
more
Carbs Carbs
+766%
Contains
more
Other Other
+1022.9%
Contains
more
Water Water
+926.6%
Fat Type Comparison
Fat type breakdown side-by-side comparison
2
32%
14%
54%
Saturated fat:
Sat. Fat
0.061 g
Monounsaturated fat:
Mono. Fat
0.027 g
Polyunsaturated fat:
Poly. Fat
0.102 g
1
58%
18%
24%
Saturated fat:
Sat. Fat
0.042 g
Monounsaturated fat:
Mono. Fat
0.013 g
Polyunsaturated fat:
Poly. Fat
0.017 g
Contains
more
Mono. Fat Monounsaturated fat
+107.7%
Contains
more
Poly. Fat Polyunsaturated fat
+500%
Contains
less
Sat. Fat Saturated fat
-31.1%