Onion Nutrition & Calories – Complete Data of All Nutrients
Summary
While onions are not exceptionally high in most macronutrients, they can be an excellent source of phytochemicals that provide an array of beneficial effects on human health.
Most of the macronutrient content of onions is composed of carbohydrates and a smaller amount of protein. Onions can also be a good source of vitamin B6 and vitamin C.
Introduction
Onions are one of the most commonly used vegetables around the world. They are famous for their flavorful taste, pungent smell, and eye-irritating qualities. However, the nutrition of onions is often left out of the conversation.
In this article, we will discuss every detail of the nutritional content of onions: macro and micronutrients, phytochemicals, nutritional differences in onion parts and varieties, and the influence of cooking.
Table of contents
- Nutrition
- Phytochemicals
- Nutritional Differences Between Different Types of Onions
- Nutritional Differences Between Onion Bulb & Green Tops
- Glycemic Index
- Acidity
- Cooking Methods on Phytochemical and Nutritional Changes
- Comparison to Similar Foods
- References
Nutrition
The nutritional information below is presented for 100g of raw onions. We will also separately compare the nutrition of specific types of onions.
One average serving of onions per person is one tablespoon of chopped onions, equal to 10g.
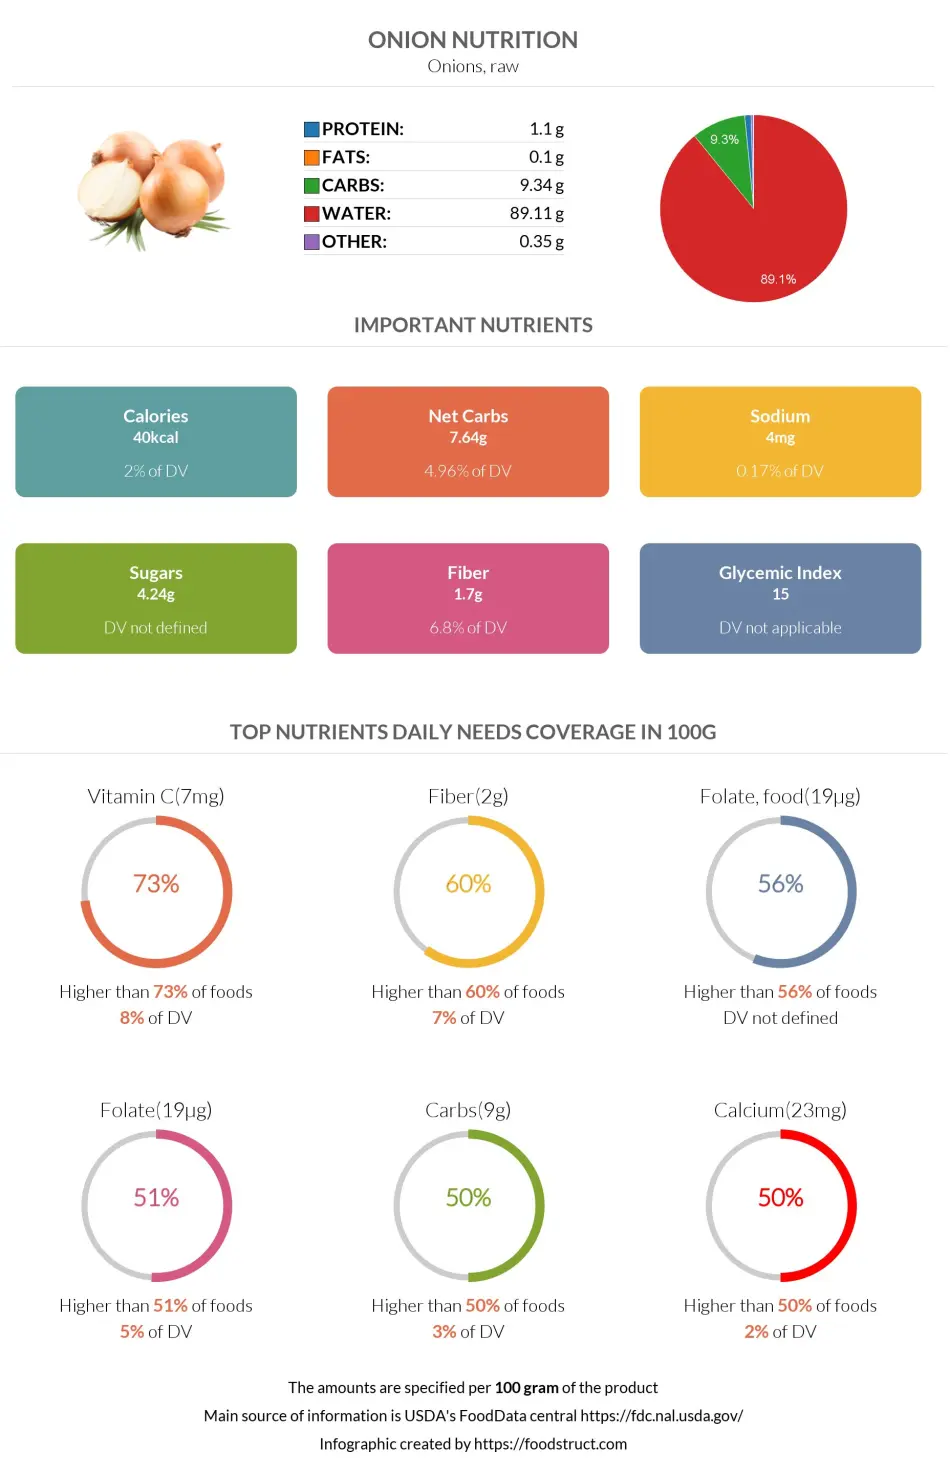
Onions are not very dense in nutrients, consisting of 87% water and only 13% nutrients.
Macronutrients chart
Calories
A 100g serving of raw onions provides 40 calories. Consequently, one average serving size of onions provide 4 calories.
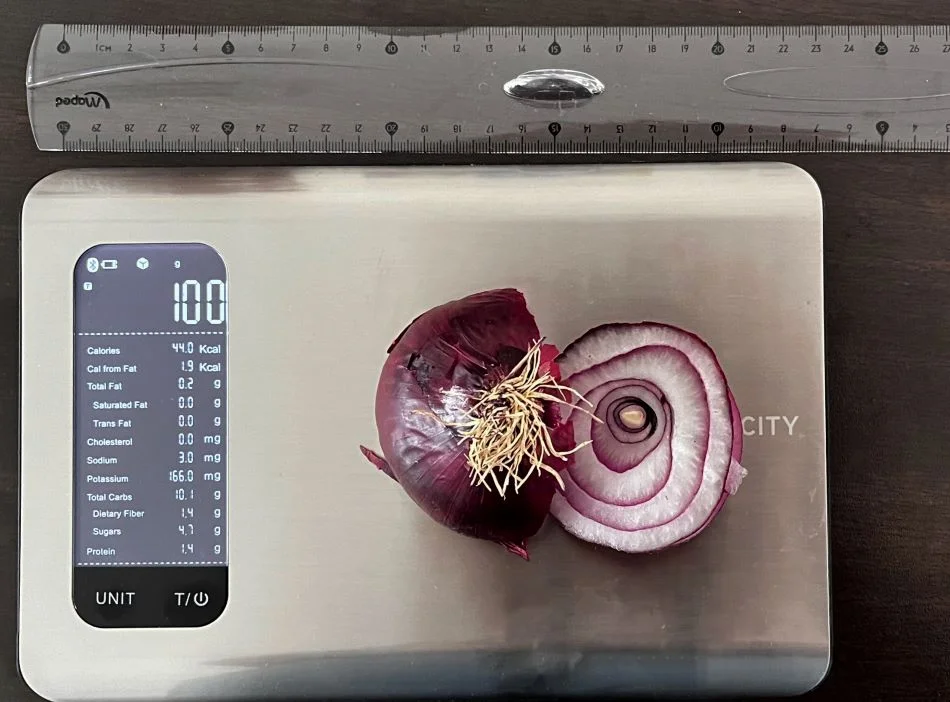
What Does 40 Calories or 100 Grams of Onion Look Like?
We measured what 100 grams of onion looks like to help you visualize its weight and calories. As evident in the picture, approximately half of a medium-sized onion accounted for the entire 100 grams or 40-44 calories. This implies that a typical onion weighs about 145 grams and contains approximately 58 calories. Keep in mind that the actual weight and calorie content may vary depending on the size of the onion.
Protein
Onions are not exceptionally high in proteins, containing only 1.1g of protein in a 100g serving.
Proteins found in onions include low levels of all essential amino acids except for methionine, which is absent in this vegetable. Onions are comparably higher in tryptophan.
Protein quality breakdown
Carbohydrates
Among macronutrient content, carbohydrates are found in the highest amounts in onions.
A hundred gram serving of onions provides 9.34g of carbohydrates.
Net Carbs
Most of the onion's carbohydrates consist of net carbs. A 100g of raw onions provides 7.64g of net carbs, 55% of which are sugars.
The predominant sugar in onions is glucose (1.97g), followed by fructose (1.29g) and sucrose (0.99g). Onions are naturally absent in starch and lactose.
Carbohydrate type breakdown
In a comparison between different varieties of onions, one study found white onions from the US contain over 3 times more sugar than red onions from Egypt (1).
Dietary Fiber
In a 100g serving, onions contain 1.7g of fiber. Of this fiber content, 37% consists of soluble fiber, and 63% consists of insoluble fiber (2).
Insoluble fiber helps the food pass more quickly and relieves constipation, whereas soluble fiber may aid in decreased blood cholesterol and glucose levels.
Fiber content ratio for Onion
Below is a carbohydrate content comparison between four onion varieties (3, 4, 5, 6).
| Variety | Carbohydrates | Net carbs | Sugars | Dietary fiber |
| Red onion | 9.9g | 7.7g | 5.76g | 2.2g |
| White onion | 7.7g | 6.5g | 5.76g | 1.2g |
| Yellow onion | 8.6g | 6.7g | 5.82g | 1.9g |
| Green onion | 5.7g | 3.9g | 3.91g | 1.8g |
FODMAPs
Onion, along with garlic, legumes, and wheat products, is a frequently consumed high-FODMAP food.
FODMAPs (fermentable oligosaccharides, disaccharides, monosaccharides, and polyols) are sugars poorly absorbed in the small intestines and mainly fermented by the colonic bacteria.
FODMAPs are safe for most people; however, they are best avoided for people with gastrointestinal diseases, such as IBS, functional abdominal distension, functional diarrhea, functional constipation, Crohn's disease, and ulcerative colitis, as they may trigger or worsen the symptoms (7, 8). Due to high FODMAPs, onions may also cause heartburn in some people.
Fats
Onions contain a negligible amount of fats - around 0.1g per every 100g serving.
Fat type information
Vitamins
Onions are a good source of vitamin C, falling in the top 27% of foods as a source of vitamin C. However, a 100g serving covers only 8% of the daily needed amount of vitamin C.
The same serving size of onions can also cover 9% of the daily needed vitamin B6 content.
Onions are relatively high in vitamin B9, also known as folate.
This vegetable contains moderate-to-low levels of vitamins A, K, and E and B1, B2, B3, and B5.
Onions are absent in vitamin D and vitamin B12.
Vitamin coverage chart
Minerals
Onions provide some levels of most essential minerals. They are relatively rich in calcium, manganese, and potassium.
These vegetables contain low amounts of magnesium, phosphorus, copper, zinc, iron, selenium, and choline.
Sodium
Onions naturally contain only 4mg of sodium per 100g serving.
Mineral coverage chart
Oxalates
Oxalates or oxalic acids are compounds in various vegetables, fruits, grains, and nuts. They are safe to consume for most people; however, they may increase the risk of some people developing calcium oxalate kidney stones.
Onion contains 5mg of oxalates per 100g, making it a low-oxalate food.
Phytochemicals
As plants, onions are abundant in health-beneficial phytonutrients that do not fall under the previously mentioned categories.
The onion species are known to contain many secondary metabolites, such as flavonoids, phytosterols, saponins, and anthocyanins (9, 1).
Potentially, the most significant importance of phytochemical compounds is their antioxidant capability, which reduces cell damage in the body by inhibiting lipid oxidation.
Due to these and various other compounds, onions have expressed anticancer, antidiabetic, antioxidant, antiplatelet, antihypertensive, antidepressant, neuroprotective, anti-inflammatory, antiparasitic effects, and more (10).
Isoalliin
Isoalliin is a major sulfur-containing component of onions, which gives this vegetable its specific taste and eye-irritating quality (11). This compound is named after the scientific name of onions - Allium cepa.
Flavonoids
Flavonoids are potent antioxidants from the polyphenol family of phytochemicals. Onions are considered an incredible source of flavonoids. In particular, onions are rich in quercetin, kaempferol, and isorhamnetin (11).
Red onions are usually richer in flavonoids than yellow and white varieties. However, the growing conditions and storage duration influence the flavonoid content (12).
Anthocyanins
Anthocyanins are also antioxidants from the phenolic group. These compounds are pigments responsible for fruits and vegetables' red, blue, and purple colorings. Therefore, red onions are considerably richer in anthocyanins than white onions (1).
Saponins
Saponins are bitter-tasting compounds found in many fruits and vegetables, including onions. This phytochemical has been proven to reduce cholesterol absorption from the intestines. Saponins have also been studied to have antifungal and antitumor qualities (13).
Nutritional Differences Between Different Types of Onions
In this section, we will look at how the nutritional contents differ based on the variety of onions. The information is presented for 100g servings of raw red, white, and yellow onions (3, 4, 5).
| Variety (raw) | Water | Calorie | Fats | Protein |
| Red onion | 88.6g | 44kcal | 0.1g | 0.9g |
| White onion | 91.2g | 36kcal | 0.13g | 0.9g |
| Yellow onion | 90.1g | 38kcal | 0.05g | 0.8g |
Red onions are slightly richer in magnesium, phosphorus, potassium, copper, and manganese, yellow onions are richer in calcium and zinc, and white onions are slightly richer in iron.
Nutritional Differences Between Onion Bulb & Green Tops
In this section, we'll compare onion bulbs to the young green tops and see which is nutritionally superior (6).
A 100g serving of onion bulbs contains 3.5g more carbohydrates; interestingly, the bulb and green tops contain almost equal amounts of dietary fiber. Onion bulb is slightly higher in protein, whereas green tops are slightly higher in fats.
Green tops are rich in vitamin A and carotenoids (terpenoid phytochemicals) called lutein and zeaxanthin, which are nearly absent in bulbs.
Vitamin A is essential for vision, the immune system, organ development, and more; its deficiency commonly causes dry eyes and, in severe cases, night blindness. Carotenoids are also essential for vision, as they filter blue light and reduce the formation of harmful free radicals (14, 15).
A 100g of the tops also contains 156mcg of vitamin K, required for blood clotting (16).
Green tops of onions are also slightly richer in minerals, vitamins B3, C, A, E, K, and folate. On the other hand, onion bulbs are slightly richer in vitamins B1, B6, and choline.
Glycemic Index
An exact number for the glycemic index value of onions has not been calculated, but it is assumed to be low.
Raw onion has been researched to lead to reduced blood glucose concentration and body weight gain (17).
Freeze-dried onion powder has been studied to be protective against hyperglycemia (high blood sugar) and dyslipidemia (imbalance of blood fats) arising from diabetes in animal studies (18).
Onion powder has also been demonstrated to decrease the glycemic index of the pasta supplemented with (19).
Acidity
The acidity of onions has been calculated to fall in the range of 6.2 (Baby variety) to 6.4 (Leek variety). Yellow, green, and red onions have a pH value of about 6.3 (20).
However, onions' potential renal acid load or PRAL value is -2, proving onions to be alkaline-forming or base-producing inside the body.
Cooking Methods on Phytochemical and Nutritional Changes
Cooking methods such as baking, boiling, frying, and grilling affect the phytochemical content and bioavailability.
Baking and grilling make the phenolic compounds' bioaccessibility the greatest compared to other cooking methods, or, in simple words, baking and grilling onions make the polyphenols more accessible for digestion and absorption in the intestines. However, cooking for extended periods may cause degradation or loss of some polyphenols (21).
During cooking, vitamin C, B-complex vitamins, and several minerals may be reduced due to being leached into the cooking water or destroyed by heat (22).
Cooking onions at a lower temperature for a short period and without draining the water may be the preferred choice to keep them nutritious.
Comparison to Similar Foods
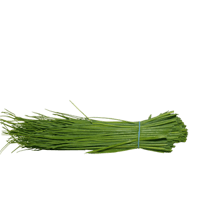
This section will compare onions with similar vegetables, namely chives, garlic, and leek.
Onions are richer in calories and net carbs than chives, while chives are richer in dietary fiber and 3 times higher in protein. Chives also contain appreciably more extensive amounts of minerals and vitamins.
Between garlic and onion, garlic is significantly higher in calories, protein, and carbohydrates, including net carbs and dietary fiber. Garlic is also richer in most vitamins, except for folate. However, it is essential to note that the average serving size of garlic is about 4 times smaller than onions.
Leeks are slightly higher in calories, protein, carbohydrates, and vitamins than garlic.
References
- https://www.ncbi.nlm.nih.gov/pmc/articles/PMC6443770/
- https://www.ars.usda.gov/ARSUserFiles/80400525/Articles/jfca15_715-723.pdf
- https://fdc.nal.usda.gov/fdc-app.html#/food-details/790577/nutrients
- https://fdc.nal.usda.gov/fdc-app.html#/food-details/1104962/nutrients
- https://fdc.nal.usda.gov/fdc-app.html#/food-details/790646/nutrients
- https://fdc.nal.usda.gov/fdc-app.html#/food-details/170006/nutrients
- https://www.ncbi.nlm.nih.gov/pmc/articles/PMC4622128/
- https://www.ncbi.nlm.nih.gov/pmc/articles/PMC5434443/
- https://www.ncbi.nlm.nih.gov/pmc/articles/PMC6337254/
- https://www.hindawi.com/journals/ecam/2022/4586318/
- https://onlinelibrary.wiley.com/doi/abs/10.1002/9781119158042.ch58
- https://www.mdpi.com/2077-0472/11/9/872
- https://www.researchgate.net/publication/7382234
- https://ods.od.nih.gov/factsheets/VitaminA-HealthProfessional/
- https://www.ncbi.nlm.nih.gov/pmc/articles/PMC8874683/
- https://medlineplus.gov/ency/article/002407.htm
- https://www.researchgate.net/publication/353719066
- https://www.ncbi.nlm.nih.gov/pmc/articles/PMC7430960/
- https://www.tandfonline.com/doi/abs/10.1080/09637486.2021.2025211
- https://www.mdpi.com/2076-3417/11/5/2317/htm
- https://www.ncbi.nlm.nih.gov/pmc/articles/PMC8151956/
- https://www.ncbi.nlm.nih.gov/pmc/articles/PMC8249525/

Top nutrition facts for Onion
| Calories ⓘ Calories for selected serving | 40 kcal |
| Glycemic index ⓘ Gi values are taken from various scientific sources. GI values less than 55 are considered as low. Values above 70 are considered as high. | 15 (low) |
| Glycemic load ⓘ Glycemic Load (GL) is a metric that measures both the quality (Glycemic Index) and quantity of carbohydrates in a specific serving of food to estimate its impact on blood sugar levels. It is calculated as: (GI × Carbs in grams) / 100. | 0 (low) |
| Net carbs ⓘ Net Carbs = Total Carbohydrates – Fiber – Sugar Alcohols | 8 g |
| Default serving size ⓘ Serving sizes are mostly taken from FDA's Reference Amounts Customarily Consumed (RACCs) | 1 tbsp chopped (10 g) |
| Acidity (Based on PRAL) ⓘ PRAL (Potential renal acid load) is calculated using a formula. On the PRAL scale the higher the positive value, the more is the acidifying effect on the body. The lower the negative value, the higher the alkalinity of the food. 0 is neutral. | -2 (alkaline) |
| Oxalates | 5 mg ⓘ https://www.researchgate.net/publication/280642641 |
Onion calories (kcal)
| Calories for different serving sizes of onion | Calories | Weight |
|---|---|---|
| Calories in 100 grams | 40 | |
| Calories in 1 slice, thin | 4 | 9 g |
| Calories in 1 tbsp chopped | 4 | 10 g |
| Calories in 10 rings | 24 | 60 g |
| Calories in 1 small | 28 | 70 g |
| Calories in 1 cup, sliced | 46 | 115 g |
| Calories in 1 large | 60 | 150 g |
| Calories in 1 cup, chopped | 64 | 160 g |
| Calories for different varieties of onion | Calories | Weight |
|---|---|---|
| Onions, raw (this food) | 40 | 100 g |
| Onions, frozen, chopped, cooked, boiled, drained, with salt | 26 | 100 g |
| Onions, frozen, whole, cooked, boiled, drained, with salt | 26 | 100 g |
| Onions, frozen, chopped, cooked, boiled, drained, without salt | 28 | 100 g |
| Onions, frozen, whole, cooked, boiled, drained, without salt | 28 | 100 g |
| Onions, frozen, chopped, unprepared | 29 | 100 g |
| Onions, frozen, whole, unprepared | 35 | 100 g |
| Onions, dehydrated flakes | 349 | 100 g |
Extra Nutrition facts for Onion
| Protein per 100 calories ⓘ Shows how many grams of protein you get from 100 calories of this food, calculated as (protein in g ÷ calories) × 100. | 2.8 g |
| Calories per 10 g protein ⓘ Shows how many calories you need to eat from this food to get 10 g of protein, calculated as (calories ÷ protein in g) × 10. | 364 kcal |
| Weight per 100 calories ⓘ Shows how many grams of this food equal 100 kcal—higher grams mean a larger portion for the same calories. | 250 g |
Onion Glycemic index (GI)
Mineral chart - relative view
Vitamin chart - relative view
All nutrients for Onion per 100g
| Nutrient | Value | DV% | In TOP % of foods | Comparison |
| Vitamin A | 0µg | 0% | 100% | |
| Calories | 40kcal | 2% | 91% |
1.2 times less than Orange
|
| Protein | 1.1g | 3% | 85% |
2.6 times less than Broccoli
|
| Weight per 100 calories | 250g | N/A | 10% | |
| Protein per 100 calories | 2.8g | N/A | 63% | |
| Calories per 10 g protein | 364kcal | N/A | 34% | |
| Fats | 0.1g | 0% | 94% |
333.1 times less than Cheese
|
| Vitamin C | 7.4mg | 8% | 18% |
7.2 times less than Lemon
|
| Net carbs | 7.6g | N/A | 51% |
7.1 times less than Chocolate
|
| Carbs | 9.3g | 3% | 51% |
3 times less than Rice
|
| Cholesterol | 0mg | 0% | 100% |
N/A
|
| Vitamin D | 0µg | 0% | 100% |
N/A
|
| Vitamin D* | 0 IU | 0% | 100% |
N/A
|
| Magnesium | 10mg | 2% | 76% |
14 times less than Almonds
|
| Calcium | 23mg | 2% | 47% |
5.4 times less than Milk
|
| Potassium | 146mg | 4% | 67% |
Equal to Cucumber
|
| Iron | 0.21mg | 3% | 87% |
12.4 times less than Beef broiled
|
| Sugar | 4.2g | N/A | 30% |
2.1 times less than Coca-Cola
|
| Fiber | 1.7g | 7% | 34% |
1.4 times less than Orange
|
| Copper | 0.04mg | 4% | 71% |
3.6 times less than Shiitake
|
| Zinc | 0.17mg | 2% | 79% |
37.1 times less than Beef broiled
|
| Starch | 0g | 0% | 100% |
N/A
|
| Phosphorus | 29mg | 4% | 78% |
6.3 times less than Chicken meat
|
| Sodium | 4mg | 0% | 92% |
122.5 times less than White bread
|
| Vitamin E | 0.02mg | 0% | 61% |
73 times less than Kiwi
|
| Manganese | 0.13mg | 6% | 34% | |
| Selenium | 0.5µg | 1% | 70% | |
| Vitamin B1 | 0.05mg | 4% | 67% |
5.8 times less than Pea raw
|
| Vitamin B2 | 0.03mg | 2% | 82% |
4.8 times less than Avocado
|
| Vitamin B3 | 0.12mg | 1% | 84% |
82.5 times less than Turkey meat
|
| Vitamin B5 | 0.12mg | 2% | 62% |
9.2 times less than Sunflower seeds
|
| Vitamin B6 | 0.12mg | 9% | 50% |
Equal to Oats
|
| Vitamin B12 | 0µg | 0% | 100% |
N/A
|
| Vitamin K | 0.4µg | 0% | 42% |
254 times less than Broccoli
|
| Trans fat | 0g | N/A | 100% |
N/A
|
| Folate | 19µg | 5% | 35% |
3.2 times less than Brussels sprouts
|
| Choline | 6.1mg | 1% | 45% | |
| Saturated fat | 0.04g | 0% | 83% |
140.4 times less than Beef broiled
|
| Monounsaturated fat | 0.01g | N/A | 84% |
753.8 times less than Avocado
|
| Polyunsaturated fat | 0.02g | N/A | 87% |
2774.9 times less than Walnut
|
| Tryptophan | 0.01mg | 0% | 53% |
21.8 times less than Chicken meat
|
| Threonine | 0.02mg | 0% | 56% |
34.3 times less than Beef broiled
|
| Isoleucine | 0.01mg | 0% | 57% |
65.3 times less than Salmon raw
|
| Leucine | 0.03mg | 0% | 57% |
97.2 times less than Tuna Bluefin
|
| Lysine | 0.04mg | 0% | 55% |
11.6 times less than Tofu
|
| Methionine | 0mg | 0% | 58% |
48 times less than Quinoa
|
| Phenylalanine | 0.03mg | 0% | 56% |
26.7 times less than Egg
|
| Valine | 0.02mg | 0% | 56% |
96.6 times less than Soybean raw
|
| Histidine | 0.01mg | 0% | 55% |
53.5 times less than Turkey meat
|
| Fructose | 1.3g | 2% | 6% |
4.6 times less than Apple
|
| Caffeine | 0mg | 0% | 100% | |
| Omega-3 - EPA | 0g | N/A | 100% |
N/A
|
| Omega-3 - DHA | 0g | N/A | 100% |
N/A
|
| Omega-3 - DPA | 0g | N/A | 100% |
N/A
|
| Omega-6 - Eicosadienoic acid | 0g | N/A | 100% |
Check out similar food or compare with current
NUTRITION FACTS LABEL
Serving Size ______________
Health checks
Onion nutrition infographic
References
All the values for which the sources are not specified explicitly are taken from FDA’s Food Central. The exact link to the food presented on this page can be found below.