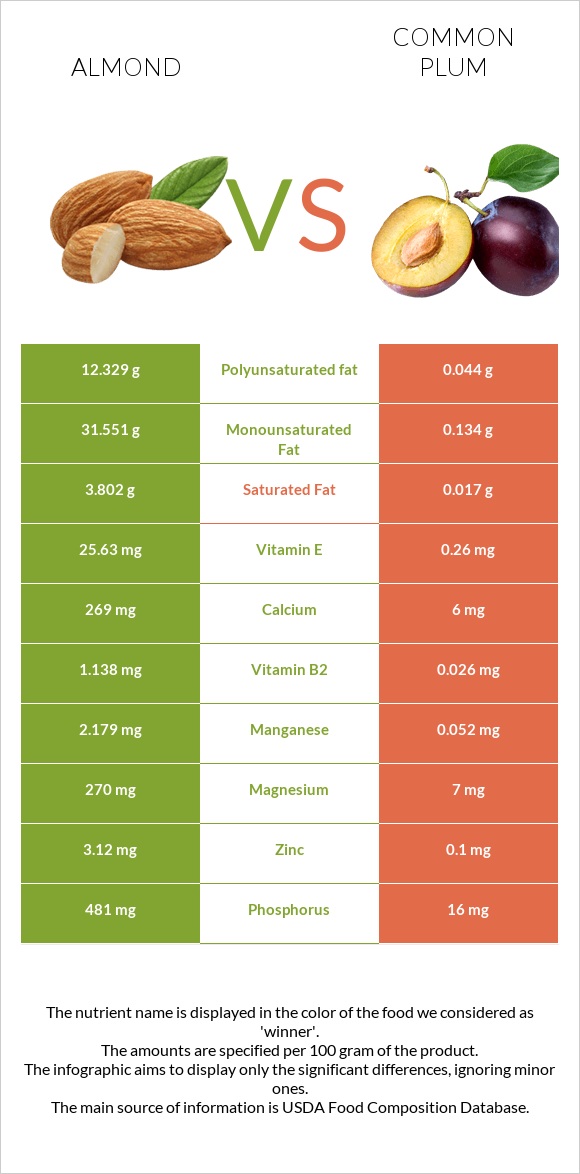
Significant differences between almonds and plums The amount of vitamin E, copper, manganese, vitamin B2, phosphorus, magnesium, fiber, iron, zinc, and calcium in almonds is higher than in plums. Almonds cover your daily vitamin E needs 169% more than plums. Plums have 45 times less calcium than almonds. Almonds have 269mg of calcium, while plums have 6mg. Plums have a higher glycemic index. The glycemic index of plums is 53, while the glycemic index of almonds is 0. Specific food types used in this comparison are Nuts, almonds and Plums, raw .
Infographic
Mineral Comparison
Mineral comparison score is based on the number of minerals by which one or the other food is richer. The "coverage" charts below show how much of the daily needs can be covered by 300 grams of the food.
9
100 g
300 g
1 almond - 1.2g 1 oz (23 whole kernels) - 28.35g 1 cup, sliced - 92g 1 cup, ground - 95g 1 cup, slivered - 108g 1 cup, whole - 143g
Magnesium
Magnesium
Calcium
Calcium
Potassium
Potassium
Iron
Iron
Copper
Copper
Zinc
Zinc
Phosphorus
Phosphorus
Sodium
Sodium
Manganese
Manganese
Selenium
Selenium
193%
81%
65%
139%
344%
85%
206%
0.13%
284%
22%
1
100 g
300 g
1 fruit (2-1/8" dia) - 66g 1 NLEA serving - 151g 1 cup, sliced - 165g
Magnesium
Magnesium
Calcium
Calcium
Potassium
Potassium
Iron
Iron
Copper
Copper
Zinc
Zinc
Phosphorus
Phosphorus
Sodium
Sodium
Manganese
Manganese
Selenium
Selenium
5%
1.8%
14%
6.4%
19%
2.7%
6.9%
0%
6.8%
0%
Vitamin Comparison
Vitamin comparison score is based on the number of vitamins by which one or the other food is richer. The "coverage" charts below show how much of the daily needs can be covered by 300 grams of the food.
7
100 g
300 g
1 almond - 1.2g 1 oz (23 whole kernels) - 28.35g 1 cup, sliced - 92g 1 cup, ground - 95g 1 cup, slivered - 108g 1 cup, whole - 143g
Vitamin C
Vit. C
Vitamin D
Vit. D
Vitamin A
Vit. A
Vitamin E
Vit. E
Vitamin B1
Vit. B1
Vitamin B2
Vit. B2
Vitamin B3
Vit. B3
Vitamin B5
Vit. B5
Vitamin B6
Vit. B6
Vitamin B12
Vit. B12
Vitamin K
Vit. K
Folate
Folate
0%
0%
0%
513%
51%
263%
68%
28%
32%
0%
0%
33%
3
100 g
300 g
1 fruit (2-1/8" dia) - 66g 1 NLEA serving - 151g 1 cup, sliced - 165g
Vitamin C
Vit. C
Vitamin D
Vit. D
Vitamin A
Vit. A
Vitamin E
Vit. E
Vitamin B1
Vit. B1
Vitamin B2
Vit. B2
Vitamin B3
Vit. B3
Vitamin B5
Vit. B5
Vitamin B6
Vit. B6
Vitamin B12
Vit. B12
Vitamin K
Vit. K
Folate
Folate
32%
0%
5.7%
5.2%
7%
6%
7.8%
8.1%
6.7%
0%
16%
3.8%
All nutrients comparison - raw data values
Nutrient
DV% diff.
Vitamin E
25.63mg
0.26mg
169%
Copper
1.031mg
0.057mg
108%
Manganese
2.179mg
0.052mg
92%
Vitamin B2
1.138mg
0.026mg
86%
Polyunsaturated fat
12.329g
0.044g
82%
Monounsaturated fat
31.551g
0.134g
79%
Fats
49.93g
0.28g
76%
Phosphorus
481mg
16mg
66%
Magnesium
270mg
7mg
63%
Iron
3.71mg
0.17mg
44%
Fiber
12.5g
1.4g
44%
Protein
21.15g
0.7g
41%
Calories
579kcal
46kcal
27%
Zinc
3.12mg
0.1mg
27%
Calcium
269mg
6mg
26%
Vitamin B3
3.618mg
0.417mg
20%
Potassium
733mg
157mg
17%
Saturated fat
3.802g
0.017g
17%
Vitamin B1
0.205mg
0.028mg
15%
Vitamin C
0mg
9.5mg
11%
Folate
44µg
5µg
10%
Choline
52.1mg
1.9mg
9%
Vitamin B6
0.137mg
0.029mg
8%
Selenium
4.1µg
0µg
7%
Vitamin B5
0.471mg
0.135mg
7%
Vitamin K
0µg
6.4µg
5%
Fructose
0.11g
3.07g
4%
Carbs
21.55g
11.42g
3%
Vitamin A
0µg
17µg
2%
Protein per 100 calories
3.7g
1.5g
N/A
Calories per 10 g protein
274kcal
657kcal
N/A
Weight per 100 calories
17g
217g
N/A
Unsaturated / Saturated Fat ratio
12
10
N/A
Net carbs
9.05g
10.02g
N/A
Sugar
4.35g
9.92g
N/A
Starch
0.72g
0g
0%
Sodium
1mg
0mg
0%
Trans fat
0.015g
0g
N/A
Tryptophan
0.211mg
0.009mg
0%
Threonine
0.601mg
0.01mg
0%
Isoleucine
0.751mg
0.014mg
0%
Leucine
1.473mg
0.015mg
0%
Lysine
0.568mg
0.016mg
0%
Methionine
0.157mg
0.008mg
0%
Phenylalanine
1.132mg
0.014mg
0%
Valine
0.855mg
0.016mg
0%
Histidine
0.539mg
0.009mg
0%
Omega-3 - ALA
0.003g
N/A
Omega-6 - Eicosadienoic acid
0.002g
N/A
Omega-6 - Linoleic acid
12.32g
N/A
Macronutrient Comparison
Macronutrient breakdown side-by-side comparison
4
21%
50%
22%
4%
3%
Protein:
21.15 g
Fats:
49.93 g
Carbs:
21.55 g
Water:
4.41 g
Other:
2.96 g
1
11%
87%
Protein:
0.7 g
Fats:
0.28 g
Carbs:
11.42 g
Water:
87.23 g
Other:
0.37 g
Contains
more
Protein Protein
+2921.4%
Contains
more
Fats Fats
+17732.1%
Contains
more
Carbs Carbs
+88.7%
Contains
more
Other Other
+700%
Contains
more
Water Water
+1878%
Fat Type Comparison
Fat type breakdown side-by-side comparison
2
8%
66%
26%
Saturated fat:
Sat. Fat
3.802 g
Monounsaturated fat:
Mono. Fat
31.551 g
Polyunsaturated fat:
Poly. Fat
12.329 g
1
9%
69%
23%
Saturated fat:
Sat. Fat
0.017 g
Monounsaturated fat:
Mono. Fat
0.134 g
Polyunsaturated fat:
Poly. Fat
0.044 g
Contains
more
Mono. Fat Monounsaturated fat
+23445.5%
Contains
more
Poly. Fat Polyunsaturated fat
+27920.5%
Contains
less
Sat. Fat Saturated fat
-99.6%
Carbohydrate type comparison
Carbohydrate type breakdown side-by-side comparison
2
14%
78%
3%
2%
Starch:
0.72 g
Sucrose:
3.95 g
Glucose:
0.17 g
Fructose:
0.11 g
Lactose:
0 g
Maltose:
0.04 g
Galactose:
0.07 g
4
16%
51%
31%
Starch:
0 g
Sucrose:
1.57 g
Glucose:
5.07 g
Fructose:
3.07 g
Lactose:
0 g
Maltose:
0.08 g
Galactose:
0.14 g
Contains
more
Starch Starch
+∞%
Contains
more
Sucrose Sucrose
+151.6%
Contains
more
Glucose Glucose
+2882.4%
Contains
more
Fructose Fructose
+2690.9%
Contains
more
Maltose Maltose
+100%
Contains
more
Galactose Galactose
+100%