Aloe vera juice vs. Rose wine — In-Depth Nutrition Comparison
Compare
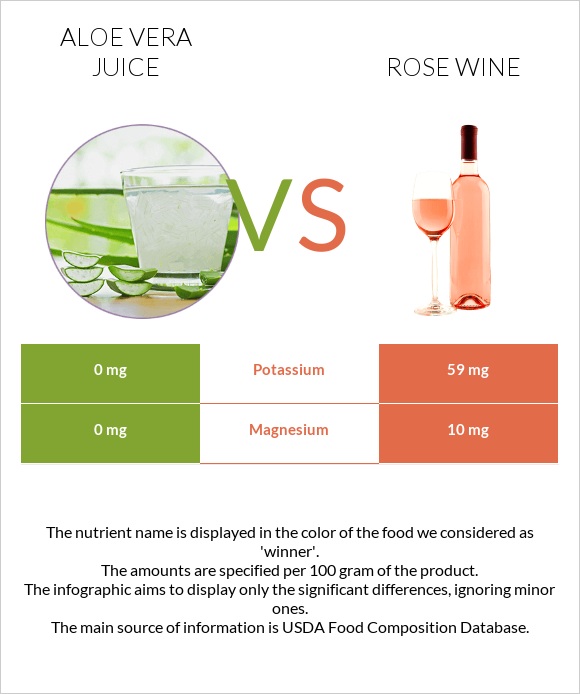
How are aloe vera juice and rose wine different?
Beverages, aloe vera juice drink, fortified with Vitamin C and Alcoholic beverages, wine, rose are the varieties used in this article.
Infographic
Infographic link
Mineral Comparison
Mineral comparison score is based on the number of minerals by which one or the other food is richer. The "coverage" charts below show how much of the daily needs can be covered by 300 grams of the food.
| Contains more MagnesiumMagnesium | +∞% |
| Contains more CalciumCalcium | +25% |
| Contains more PotassiumPotassium | +∞% |
| Contains more IronIron | +33.3% |
| Contains more CopperCopper | +∞% |
| Contains more ZincZinc | +∞% |
| Contains more PhosphorusPhosphorus | +∞% |
| Contains less SodiumSodium | -37.5% |
| Contains more SeleniumSelenium | +∞% |
Vitamin Comparison
Vitamin comparison score is based on the number of vitamins by which one or the other food is richer. The "coverage" charts below show how much of the daily needs can be covered by 300 grams of the food.
| Contains more Vitamin CVitamin C | +∞% |
| Contains more Vitamin B1Vitamin B1 | +∞% |
| Contains more Vitamin B2Vitamin B2 | +∞% |
| Contains more Vitamin B3Vitamin B3 | +∞% |
| Contains more Vitamin B6Vitamin B6 | +∞% |
| Contains more Vitamin B12Vitamin B12 | +∞% |
| Contains more FolateFolate | +∞% |
All nutrients comparison - raw data values
| Nutrient |  |
 |
DV% diff. |
| Manganese | 0.131mg | 6% | |
| Vitamin C | 3.8mg | 0mg | 4% |
| Calories | 15kcal | 83kcal | 3% |
| Phosphorus | 0mg | 18mg | 3% |
| Vitamin B5 | 0.148mg | 3% | |
| Vitamin B6 | 0mg | 0.037mg | 3% |
| Fructose | 2.1g | 3% | |
| Magnesium | 0mg | 10mg | 2% |
| Potassium | 0mg | 59mg | 2% |
| Vitamin B1 | 0mg | 0.02mg | 2% |
| Protein | 0g | 0.36g | 1% |
| Iron | 0.15mg | 0.2mg | 1% |
| Copper | 0mg | 0.005mg | 1% |
| Zinc | 0mg | 0.11mg | 1% |
| Vitamin B2 | 0mg | 0.015mg | 1% |
| Vitamin B3 | 0mg | 0.09mg | 1% |
| Weight per 100 calories | 667g | 120g | N/A |
| Net carbs | 3.75g | 3.8g | N/A |
| Carbs | 3.75g | 3.8g | 0% |
| Calcium | 8mg | 10mg | 0% |
| Sugar | 3.75g | 3.8g | N/A |
| Sodium | 8mg | 5mg | 0% |
| Selenium | 0µg | 0.2µg | 0% |
| Vitamin B12 | 0µg | 0.01µg | 0% |
| Folate | 0µg | 1µg | 0% |
Macronutrient Comparison
Macronutrient breakdown side-by-side comparison
Protein:
0 g
Fats:
0 g
Carbs:
3.75 g
Water:
96.23 g
Other:
0.02 g
Protein:
0.36 g
Fats:
0 g
Carbs:
3.8 g
Water:
86.4 g
Other:
9.44 g
| Contains more WaterWater | +11.4% |
| Contains more ProteinProtein | +∞% |
| Contains more OtherOther | +47100% |
~equal in
Fats
~0g
~equal in
Carbs
~3.8g


