Arugula vs. Watercress — Health Impact and Nutrition Comparison


Summary
Although both arugula and watercress are low-calorie and low-carb foods, arugula contains relatively more calories and carbs.
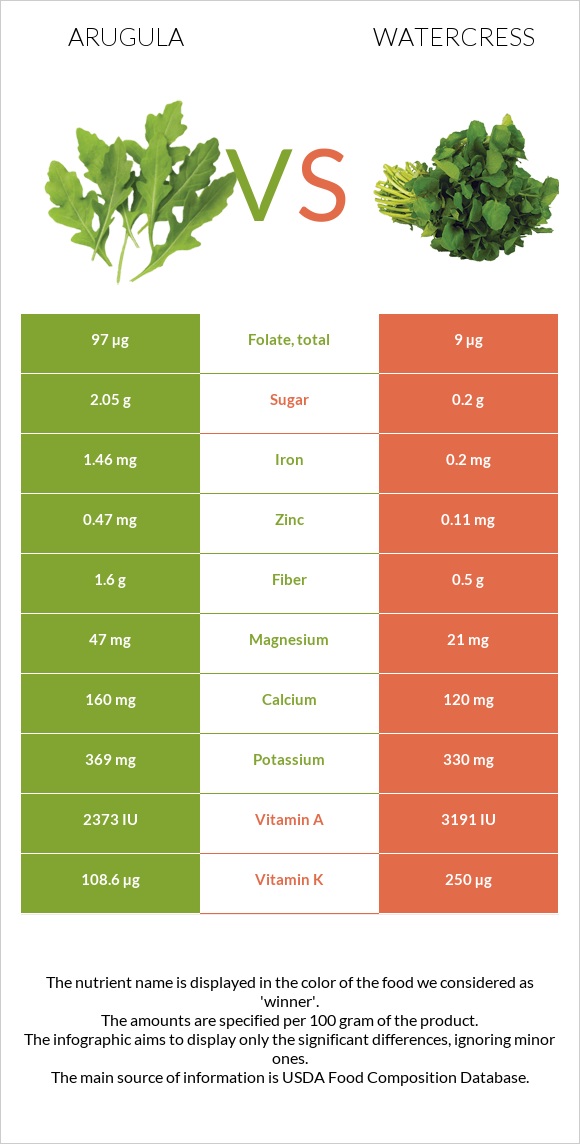
Watercress generally contains higher levels of vitamins, while arugula contains higher levels of minerals. Watercress contains 2 times more Vitamin K and 3 times more Vitamin C, while arugula contains 11 times more folate, as well as more iron, calcium, magnesium, and manganese.
Introduction
In this article, we will compare arugula and watercress in terms of nutrition and their health impact.
What's the Actual Difference?
Watercress and arugula have many similarities. They both are aquatic plants that belong to the Brassicaceae family. Arugula has a fresh, tart, bitter taste; its leaves have smoother sides and a rounded top, while watercress has a peppery flavor, similar to mustard and wasabi, and is soft, mid-green leaves with an unbroken edge and an oval shape.
Nutrition
In this section, we will look into the nutritional differences between raw arugula and raw watercress.
The recommended serving sizes of both watercress and arugula equal one cup, which corresponds to 20 grams of arugula and 34 grams of watercress.
Macronutrients
Just like most vegetables, arugula and watercress are mostly made of water. Arugula consists of 92% water, and watercress consists of 95% water.
Macronutrient Comparison
Contains
more
ProteinProtein
+12.2%
Contains
more
FatsFats
+560%
Contains
more
CarbsCarbs
+182.9%
Contains
more
OtherOther
+16.7%
Calories
Both arugula and watercress are low in calories; however, arugula has 2 times more calories than watercress.
Arugula contains 25 calories per 100-gram serving, whereas watercress contains 11 calories per 100g.
Carbohydrates
Both watercress and arugula are low-carb foods; however, arugula contains around 3 times more carbs than watercress.
Arugula contains 3.65g of carbs per 100g, whereas watercress contains 1.29g of carbs per 100g.
Fats
In 100-gram servings of arugula and watercress, there is less than 1g of fat. Watercress contains 0.1g of fat, and arugula contains 0.66g of fat.
Watercress and arugula have no cholesterol.
Protein
Watercress and arugula have negligible amounts of protein.
Vitamins
The vitamin content of watercress is richer than that of arugula.
Watercress contains 2 times more Vitamin K, 3 times more Vitamin C, and slightly more Vitamin A compared to arugula. On the other hand, arugula contains 11 times more folate.
Watercress falls in the top 12% of foods as a source of Vitamin A. A 100-gram serving of watercress is enough to cover your daily need for Vitamin A.
Vitamin Comparison
Contains
more
Vitamin B3Vitamin B3
+52.5%
Contains
more
Vitamin B5Vitamin B5
+41%
Contains
more
FolateFolate
+977.8%
Contains
more
Vitamin CVitamin C
+186.7%
Contains
more
Vitamin AVitamin A
+34.5%
Contains
more
Vitamin EVitamin E
+132.6%
Contains
more
Vitamin B1Vitamin B1
+104.5%
Contains
more
Vitamin B2Vitamin B2
+39.5%
Contains
more
Vitamin B6Vitamin B6
+76.7%
Contains
more
Vitamin KVitamin K
+130.2%
Minerals
Arugula is richer in most minerals compared to watercress.
Arugula contains more iron, calcium, magnesium, and manganese when compared to watercress.
Arugula and watercress also have similar amounts of other minerals, including copper, phosphorus, and potassium.
Mineral Comparison
Contains
more
MagnesiumMagnesium
+123.8%
Contains
more
CalciumCalcium
+33.3%
Contains
more
PotassiumPotassium
+11.8%
Contains
more
IronIron
+630%
Contains
more
ZincZinc
+327.3%
Contains
less
SodiumSodium
-34.1%
Contains
more
ManganeseManganese
+31.6%
Contains
more
PhosphorusPhosphorus
+15.4%
Contains
more
SeleniumSelenium
+200%
Glycemic Index
Both arugula and watercress are considered low glycemic index foods.
The glycemic index of arugula and watercress are both equal to 32.
Acidity
One way to understand the acidity of foods is through their potential renal acid load (PRAL) value. The PRAL value shows how much acid or base the given food produces inside the organism.
The PRAL values of arugula and watercress are -7.9 and -5.7, respectively, which means that arugula has a greater potential to alkalize the body.
Health Impact
Cardiovascular Health
Comparing arugula and watercress in terms of cardiovascular disease (CVD) can provide valuable insights into their potential benefits for heart health:
Arugula contains moderate levels of dietary nitrates, which can contribute to improved cardiovascular health by promoting vasodilation, enhancing blood flow, and lowering blood pressure (1).
Watercress contains exceptionally high levels of dietary nitrates, making it a potent natural source for supporting heart health. Regular consumption of watercress has been linked to reduced blood pressure and improved endothelial function.
Both arugula and watercress are rich in antioxidants, which help combat oxidative stress and inflammation, key contributors to the development of cardiovascular disease. Antioxidants like beta-carotene and lutein found in these greens may help protect against the oxidation of LDL (“bad” cholesterol), reducing the risk of atherosclerosis (2).
Incorporating a variety of leafy greens, like arugula and watercress, into the diet, along with other fruits, vegetables, whole grains, and lean proteins, is associated with better heart health and a reduced risk of cardiovascular disease.
In summary, both arugula and watercress offer potential benefits for cardiovascular health due to their nutrient content, antioxidant properties, and anti-inflammatory effects. Regularly including these greens in a balanced diet can contribute to overall heart health and help reduce the risk of cardiovascular disease.
Cancer
According to one study, arugula is exceptionally high in cancer-fighting compounds (3). In vitro studies have demonstrated that arugula extract is beneficial in targeting cancer stem cells and inhibiting cancer cell reproduction and invasion.
Watercress outperformed other greens in one study regarding total phenol content and ability to neutralize free radicals linked to oxidative stress and several cancer types (4).
Diabetes
Research indicates that eating vegetables reduces the risk of developing type 2 diabetes. Arugula is high in lutein and zeaxanthin, two antioxidants beneficial to the eyes. Because diabetes increases your risk of eye diseases, eating plenty of lutein and zeaxanthin may help lower the risk of blindness, glaucoma, macular degeneration, and other devastating vision problems. They also aid in reducing blood pressure, which is a significant risk factor for heart disease (5).
Bone Health
Arugula contains Vitamin K and the minerals manganese and calcium, which are all critical for bone health. Numerous studies show that low calcium intake throughout life is linked to low bone mass and a high fracture rate (6). Inadequate calcium intake contributes significantly to the development of osteoporosis.
References

Infographic
All nutrients comparison - raw data values
| Nutrient | |
|
DV% diff. |
| Vitamin K | 108.6µg | 250µg | 118% |
| Vitamin C | 15mg | 43mg | 31% |
| Folate | 97µg | 9µg | 22% |
| Iron | 1.46mg | 0.2mg | 16% |
| Magnesium | 47mg | 21mg | 6% |
| Vitamin A | 119µg | 160µg | 5% |
| Calcium | 160mg | 120mg | 4% |
| Fiber | 1.6g | 0.5g | 4% |
| Vitamin E | 0.43mg | 1mg | 4% |
| Vitamin B1 | 0.044mg | 0.09mg | 4% |
| Vitamin B6 | 0.073mg | 0.129mg | 4% |
| Zinc | 0.47mg | 0.11mg | 3% |
| Manganese | 0.321mg | 0.244mg | 3% |
| Vitamin B2 | 0.086mg | 0.12mg | 3% |
| Vitamin B5 | 0.437mg | 0.31mg | 3% |
| Polyunsaturated fat | 0.319g | 0.035g | 2% |
| Calories | 25kcal | 11kcal | 1% |
| Protein | 2.58g | 2.3g | 1% |
| Fats | 0.66g | 0.1g | 1% |
| Carbs | 3.65g | 1.29g | 1% |
| Potassium | 369mg | 330mg | 1% |
| Phosphorus | 52mg | 60mg | 1% |
| Sodium | 27mg | 41mg | 1% |
| Selenium | 0.3µg | 0.9µg | 1% |
| Vitamin B3 | 0.305mg | 0.2mg | 1% |
| Choline | 15.3mg | 9mg | 1% |
| Protein per 100 calories | 10g | 21g | N/A |
| Calories per 10 g protein | 97kcal | 48kcal | N/A |
| Weight per 100 calories | 400g | 909g | N/A |
| Net carbs | 2.05g | 0.79g | N/A |
| Sugar | 2.05g | 0.2g | N/A |
| Copper | 0.076mg | 0.077mg | 0% |
| Saturated fat | 0.086g | 0.027g | 0% |
| Monounsaturated fat | 0.049g | 0.008g | 0% |
| Tryptophan | 0.03mg | 0% | |
| Threonine | 0.133mg | 0% | |
| Isoleucine | 0.093mg | 0% | |
| Leucine | 0.166mg | 0% | |
| Lysine | 0.134mg | 0% | |
| Methionine | 0.02mg | 0% | |
| Phenylalanine | 0.114mg | 0% | |
| Valine | 0.137mg | 0% | |
| Histidine | 0.04mg | 0% |
Fat Type Comparison
| Contains more Mono. FatMonounsaturated fat | +512.5% |
| Contains more Poly. FatPolyunsaturated fat | +811.4% |
| Contains less Sat. FatSaturated fat | -68.6% |
People also compare


References
All the values for which the sources are not specified explicitly are taken from FDA’s Food Central. The exact link to the food presented on this page can be found below.
- Arugula - https://fdc.nal.usda.gov/fdc-app.html#/food-details/169387/nutrients
- Watercress - https://fdc.nal.usda.gov/fdc-app.html#/food-details/170068/nutrients
All the Daily Values are presented for males aged 31-50, for 2000-calorie diets.