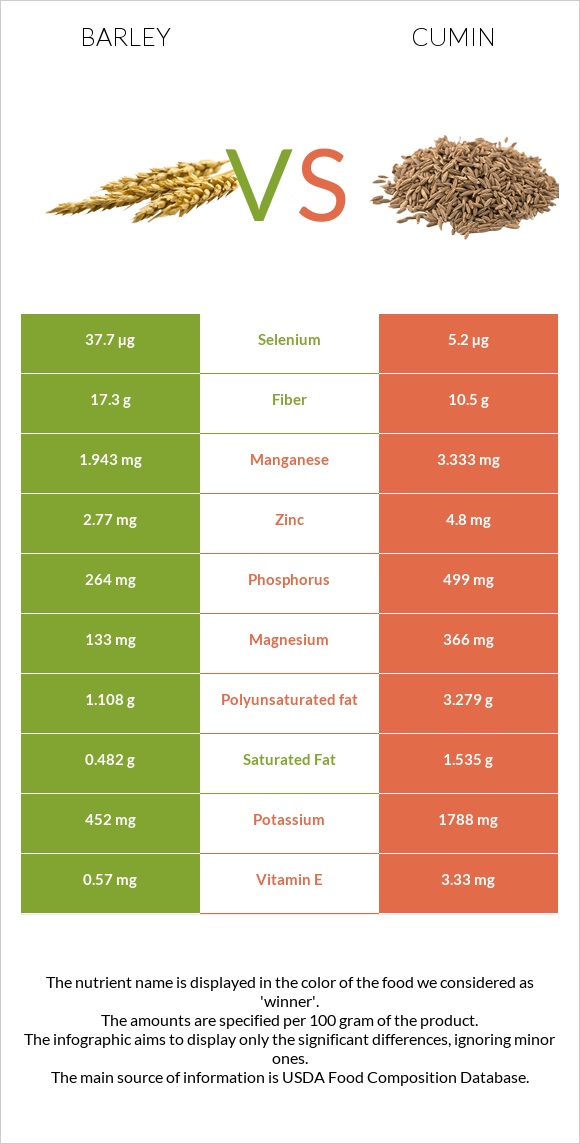
How are barley and cumin different? Barley is richer in selenium and fiber, while cumin is higher in iron, calcium, manganese, magnesium, copper, potassium, phosphorus, and vitamin A. Cumin covers your daily need for iron, 785% more than barley. Barley contains 7 times more selenium than cumin. Barley contains 37.7µg of selenium, while cumin contains 5.2µg. Barley has a higher glycemic index (28) than cumin (0). Barley, hulled and Spices, cumin seed types were used in this article.
Infographic
Mineral Comparison
Mineral comparison score is based on the number of minerals by which one or the other food is richer. The "coverage" charts below show how much of the daily needs can be covered by 300 grams of the food.
2
100 g
300 g
1 cup - 184g
Magnesium
Magnesium
Calcium
Calcium
Potassium
Potassium
Iron
Iron
Copper
Copper
Zinc
Zinc
Phosphorus
Phosphorus
Sodium
Sodium
Manganese
Manganese
Selenium
Selenium
95%
9.9%
40%
135%
166%
76%
113%
1.6%
253%
206%
8
100 g
300 g
0.25 tsp, whole - 0.5g 1 tbsp, whole - 6g
Magnesium
Magnesium
Calcium
Calcium
Potassium
Potassium
Iron
Iron
Copper
Copper
Zinc
Zinc
Phosphorus
Phosphorus
Sodium
Sodium
Manganese
Manganese
Selenium
Selenium
261%
279%
158%
2489%
289%
131%
214%
22%
435%
28%
Vitamin Comparison
Vitamin comparison score is based on the number of vitamins by which one or the other food is richer. The "coverage" charts below show how much of the daily needs can be covered by 300 grams of the food.
2
100 g
300 g
1 cup - 184g
Vitamin C
Vit. C
Vitamin D
Vit. D
Vitamin A
Vit. A
Vitamin E
Vit. E
Vitamin B1
Vit. B1
Vitamin B2
Vit. B2
Vitamin B3
Vit. B3
Vitamin B5
Vit. B5
Vitamin B6
Vit. B6
Vitamin B12
Vit. B12
Vitamin K
Vit. K
Folate
Folate
0%
0%
0.33%
11%
162%
66%
86%
17%
73%
0%
5.5%
14%
6
100 g
300 g
0.25 tsp, whole - 0.5g 1 tbsp, whole - 6g
Vitamin C
Vit. C
Vitamin D
Vit. D
Vitamin A
Vit. A
Vitamin E
Vit. E
Vitamin B1
Vit. B1
Vitamin B2
Vit. B2
Vitamin B3
Vit. B3
Vitamin B5
Vit. B5
Vitamin B6
Vit. B6
Vitamin B12
Vit. B12
Vitamin K
Vit. K
Folate
Folate
26%
0%
21%
67%
157%
75%
86%
0%
100%
0%
14%
7.5%
All nutrients comparison - raw data values
Nutrient
DV% diff.
Iron
3.6mg
66.36mg
785%
Calcium
33mg
931mg
90%
Manganese
1.943mg
3.333mg
60%
Selenium
37.7µg
5.2µg
59%
Magnesium
133mg
366mg
55%
Copper
0.498mg
0.867mg
41%
Potassium
452mg
1788mg
39%
Phosphorus
264mg
499mg
34%
Monounsaturated fat
0.295g
14.04g
34%
Fats
2.3g
22.27g
31%
Fiber
17.3g
10.5g
27%
Zinc
2.77mg
4.8mg
18%
Vitamin E
0.57mg
3.33mg
18%
Polyunsaturated fat
1.108g
3.279g
14%
Protein
12.48g
17.81g
11%
Carbs
73.48g
44.24g
10%
Vitamin C
0mg
7.7mg
9%
Vitamin B6
0.318mg
0.435mg
9%
Sodium
12mg
168mg
7%
Vitamin A
1µg
64µg
7%
Vitamin B5
0.282mg
6%
Saturated fat
0.482g
1.535g
5%
Choline
24.7mg
4%
Vitamin B2
0.285mg
0.327mg
3%
Vitamin K
2.2µg
5.4µg
3%
Vitamin B1
0.646mg
0.628mg
2%
Folate
19µg
10µg
2%
Calories
354kcal
375kcal
1%
Protein per 100 calories
3.5g
4.7g
N/A
Calories per 10 g protein
284kcal
211kcal
N/A
Weight per 100 calories
28g
27g
N/A
Unsaturated / Saturated Fat ratio
2.9
11
N/A
Net carbs
56.18g
33.74g
N/A
Sugar
0.8g
2.25g
N/A
Vitamin B3
4.604mg
4.579mg
0%
Tryptophan
0.208mg
0%
Threonine
0.424mg
0%
Isoleucine
0.456mg
0%
Leucine
0.848mg
0%
Lysine
0.465mg
0%
Methionine
0.24mg
0%
Phenylalanine
0.7mg
0%
Valine
0.612mg
0%
Histidine
0.281mg
0%
Macronutrient Comparison
Macronutrient breakdown side-by-side comparison
2
12%
2%
73%
9%
2%
Protein:
12.48 g
Fats:
2.3 g
Carbs:
73.48 g
Water:
9.44 g
Other:
2.3 g
3
18%
22%
44%
8%
8%
Protein:
17.81 g
Fats:
22.27 g
Carbs:
44.24 g
Water:
8.06 g
Other:
7.62 g
Contains
more
Carbs Carbs
+66.1%
Contains
more
Water Water
+17.1%
Contains
more
Protein Protein
+42.7%
Contains
more
Fats Fats
+868.3%
Contains
more
Other Other
+231.3%
Fat Type Comparison
Fat type breakdown side-by-side comparison
1
26%
16%
59%
Saturated fat:
Sat. Fat
0.482 g
Monounsaturated fat:
Mono. Fat
0.295 g
Polyunsaturated fat:
Poly. Fat
1.108 g
2
8%
74%
17%
Saturated fat:
Sat. Fat
1.535 g
Monounsaturated fat:
Mono. Fat
14.04 g
Polyunsaturated fat:
Poly. Fat
3.279 g
Contains
less
Sat. Fat Saturated fat
-68.6%
Contains
more
Mono. Fat Monounsaturated fat
+4659.3%
Contains
more
Poly. Fat Polyunsaturated fat
+195.9%